Interactive charts

Onze Lucht

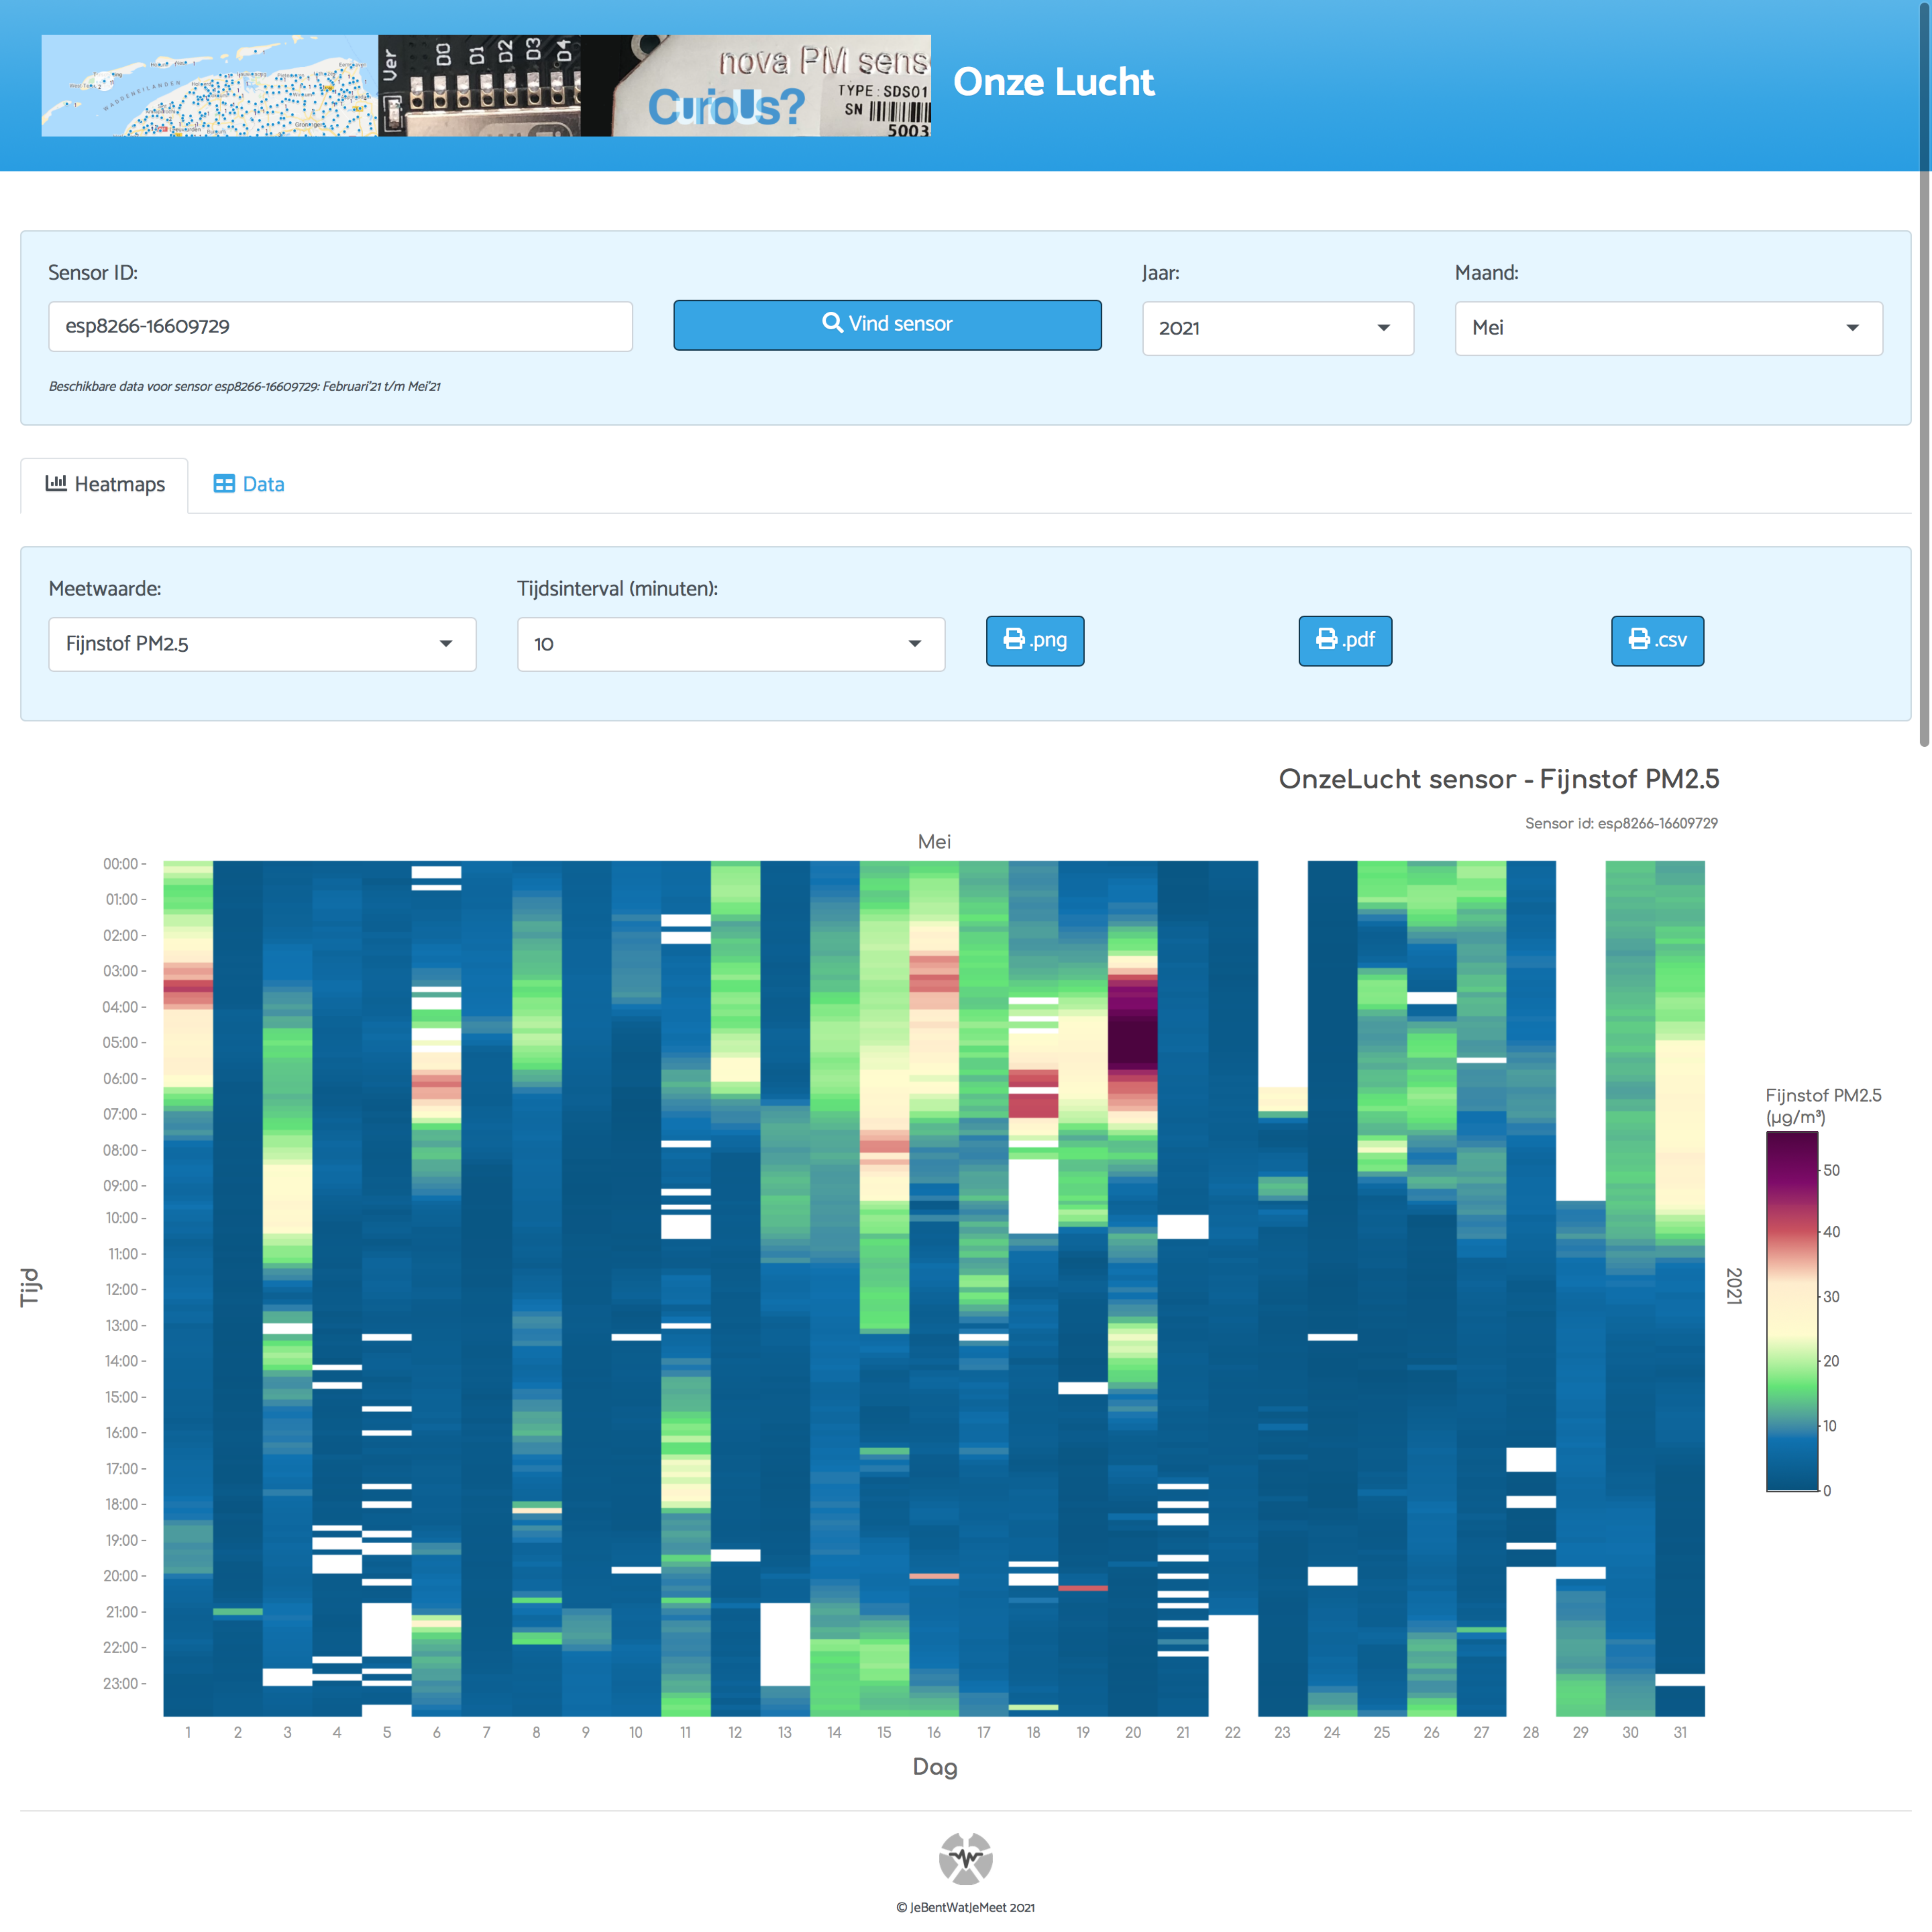
Onze Lucht is a citizen science project in the Netherlands where citizens use home-build sensors to measure air quality (PM2.5, PM10), temperature and humidity. I created an R Shiny app that visualizes monthly air quality in interactive heatmaps.

echarts4r

I tried echarts4r, an R package that interfaces with the JavaScript echarts library, to visualize my Ōura Ring data. Echarts4r appeared very intuitive and versatile and allowed me to easily create several good-looking charts that were ready for the web!