Was het Donker?
Visualizing sky brightness in the Netherlands
By Irene van den Broek in Environment
March 1, 2021
Was het Donker?

Was het Donker? is a citizen science project in the North of the Netherlands where citizens measure sky brightness with a sky quality meters (Unihedron SQM-LU) to monitor light pollution in their living environment.
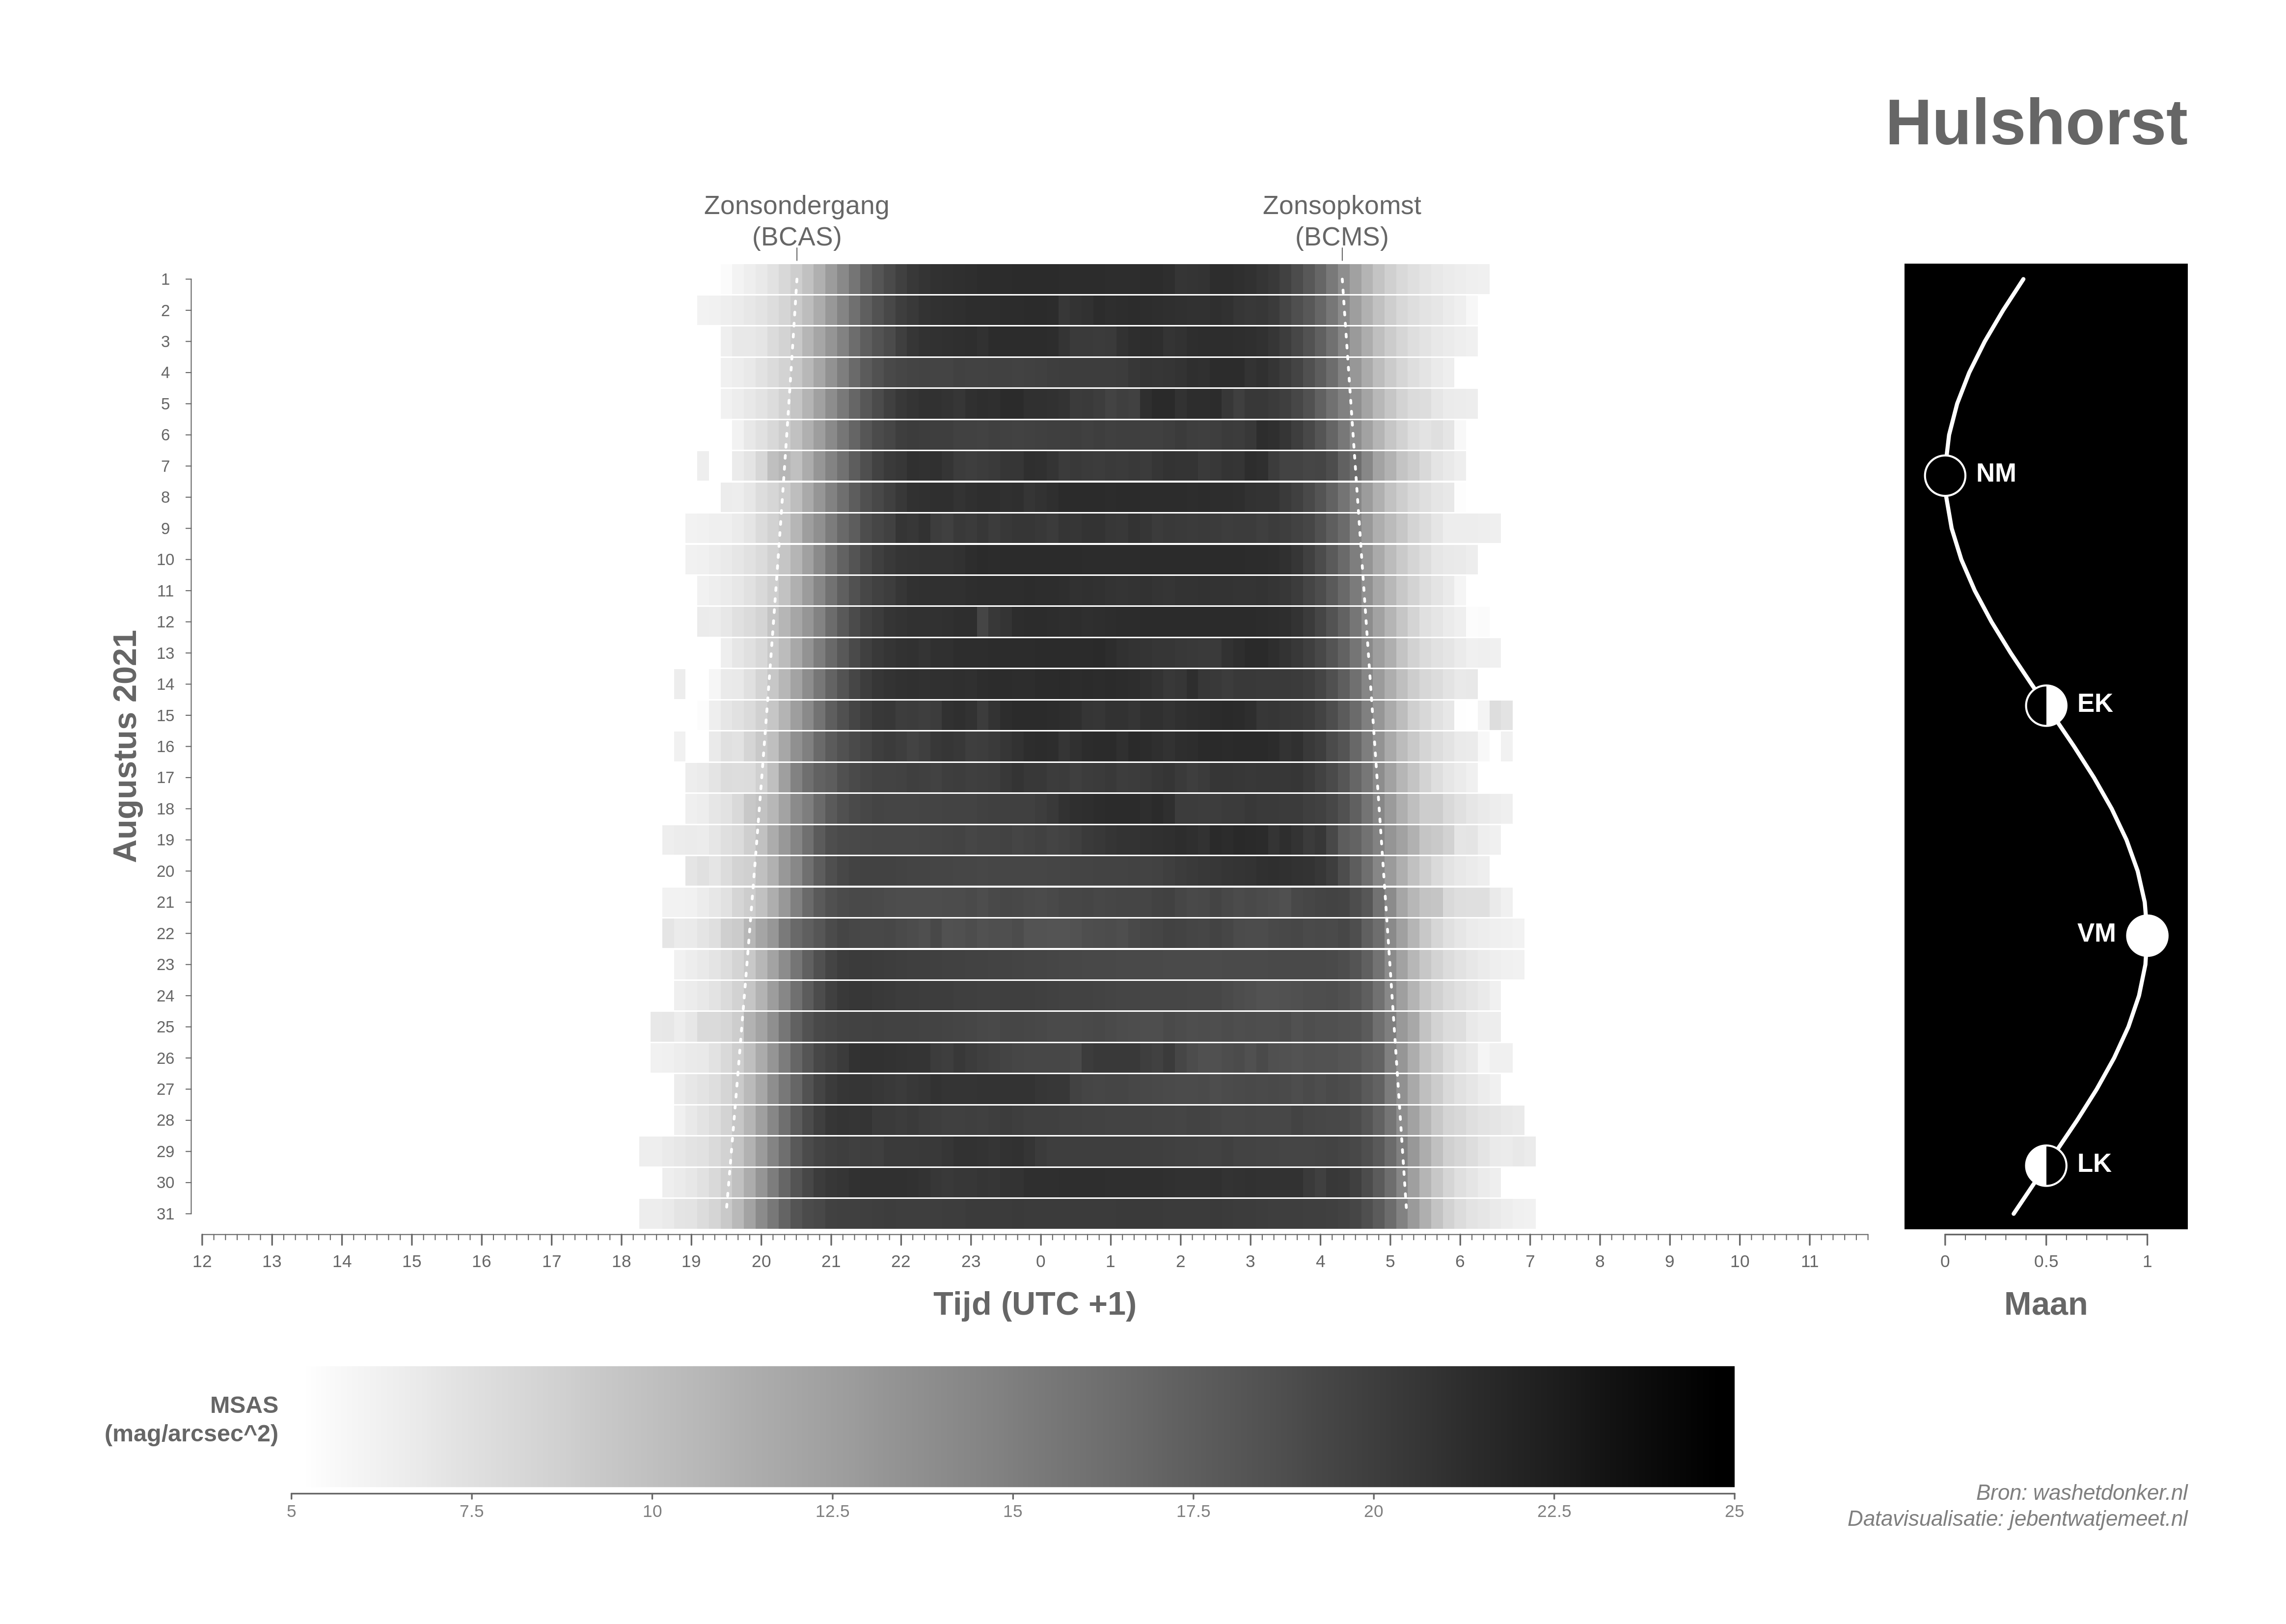
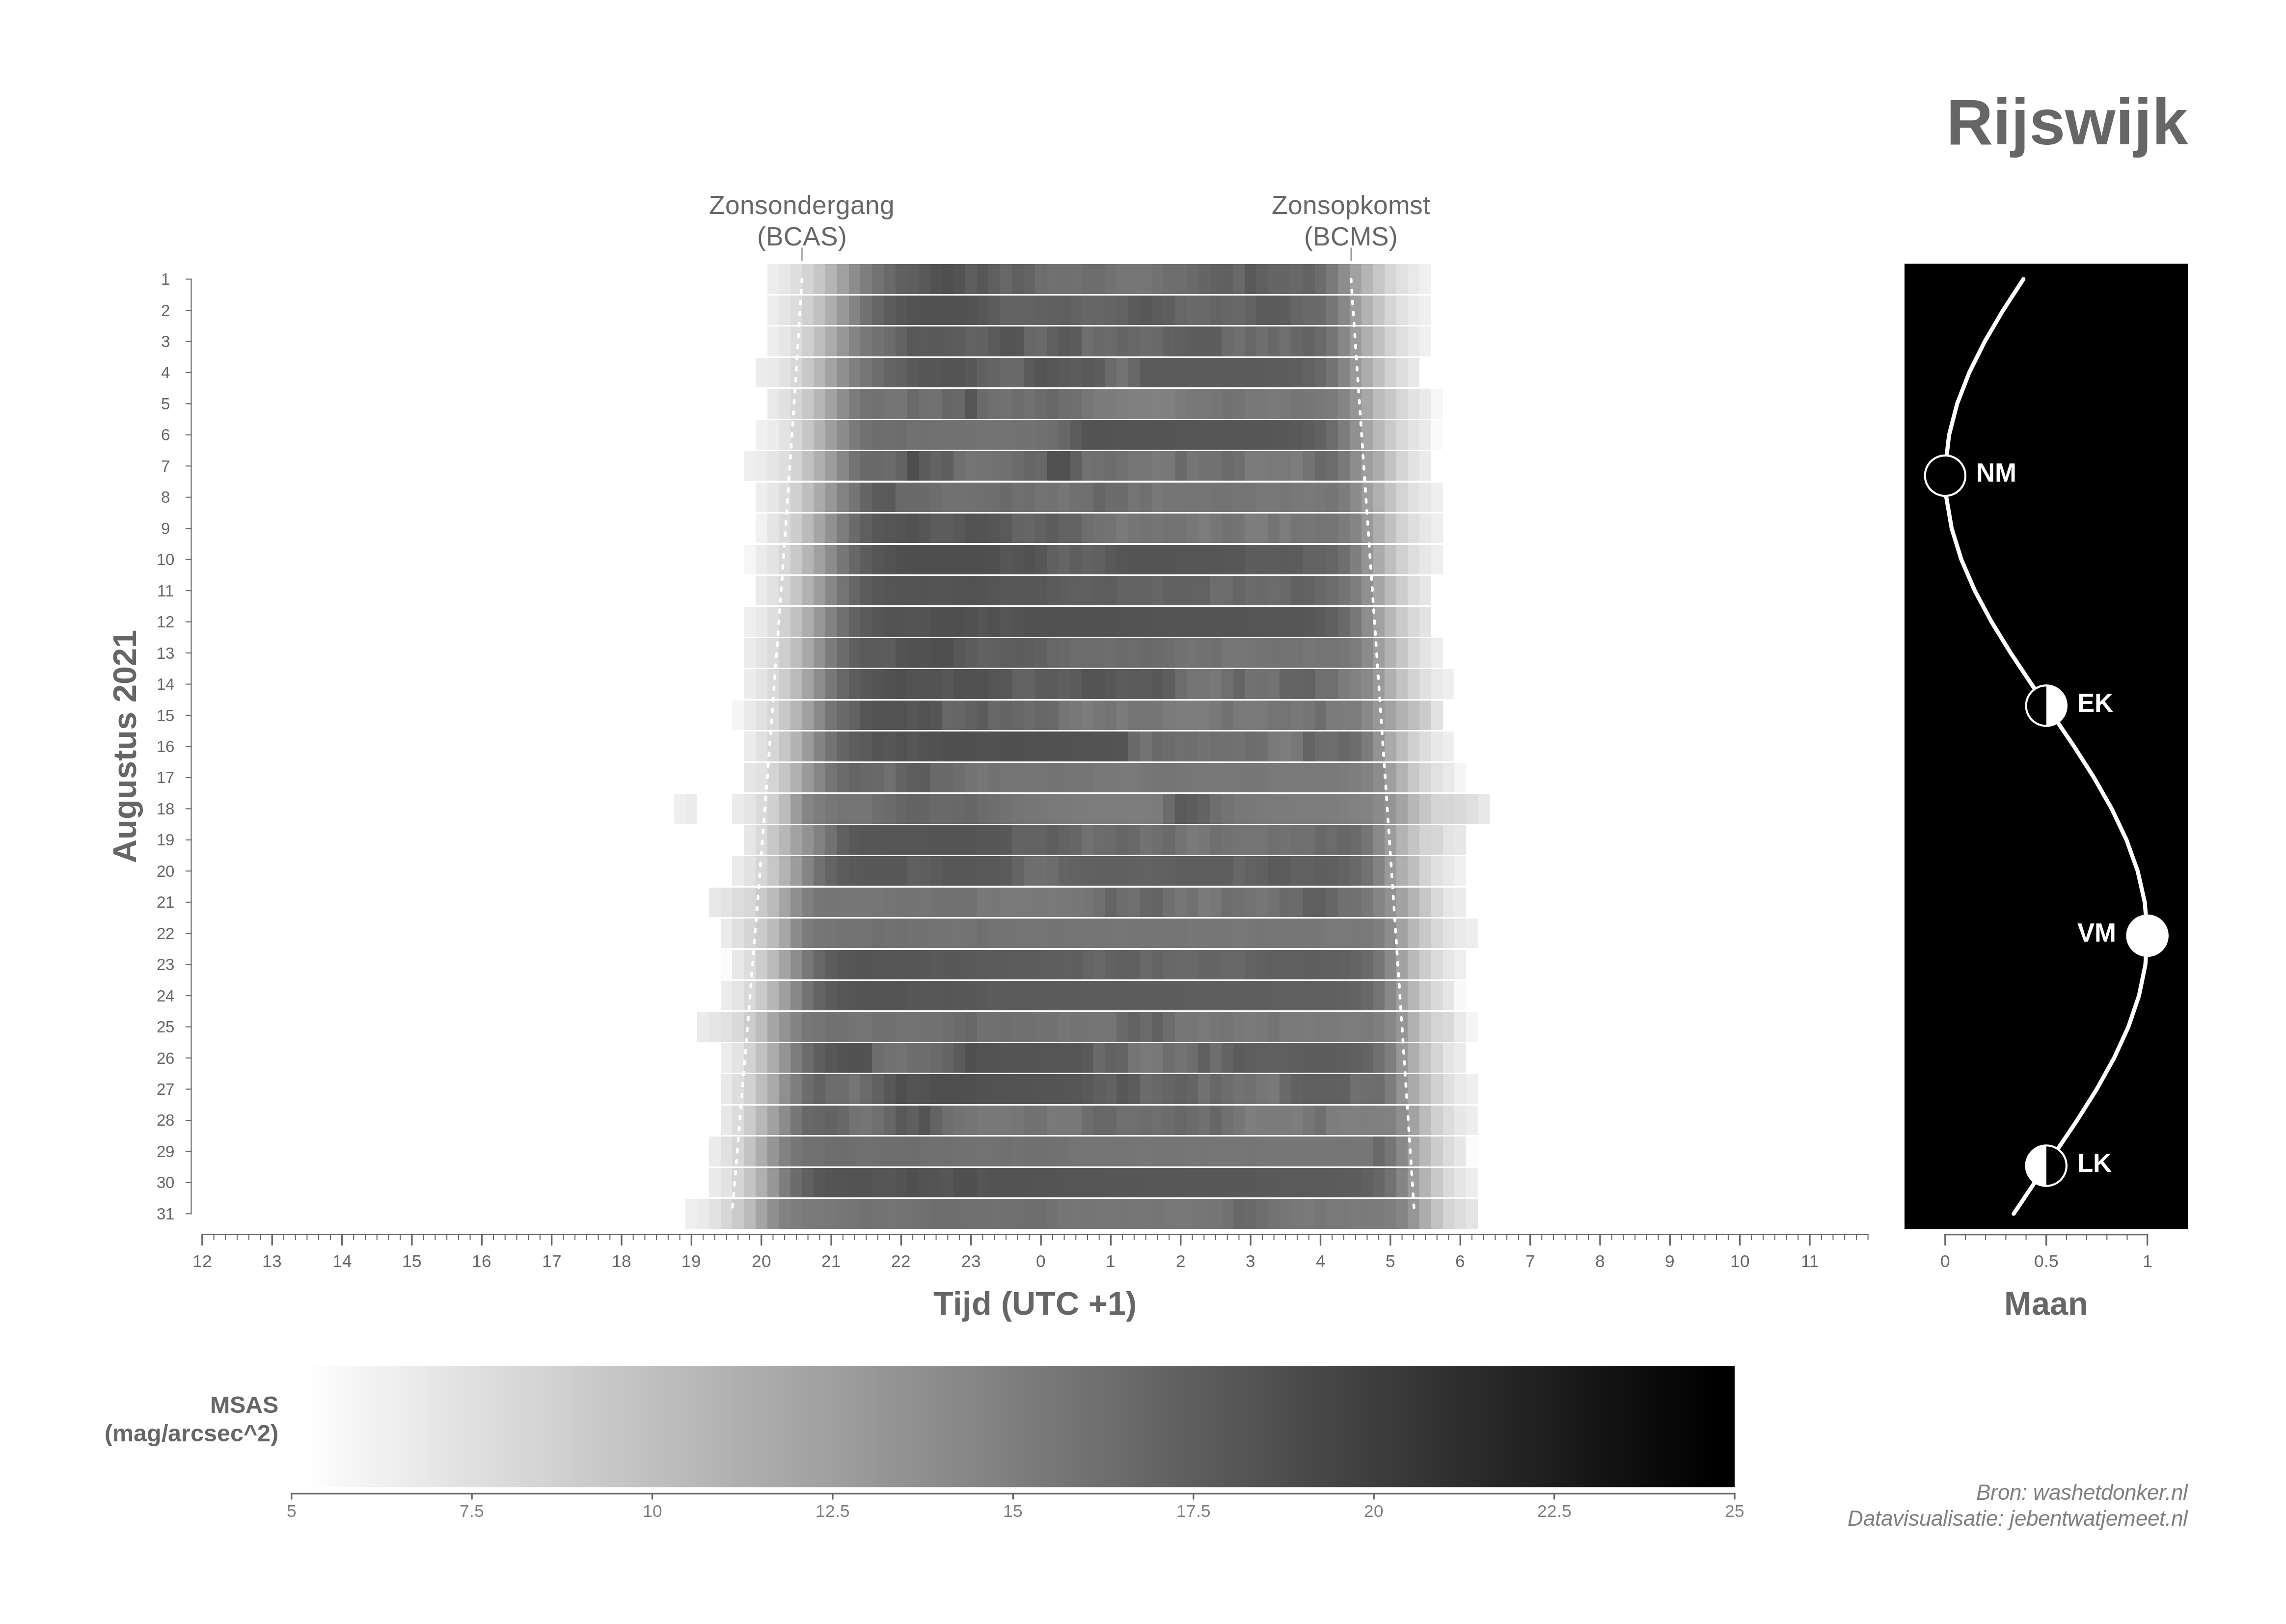
I created a heatmap that visualizes the monthly sky brightness alongside the moon phase.
You can view all heatmaps for all locations at the Was het Donker website
Hulshorst (my back yard 🏡)
Rijswijk (urban area with numerous greenhouses 🌃)
Vlieland (rural area on sparsely populated island 🌌)

- Posted on:
- March 1, 2021
- Length:
- 1 minute read, 85 words
- Categories:
- Environment
- Tags:
- Light Pollution Heatmap
- See Also:
- Onze Lucht