What is heart rate variability or HRV?
The mind is for seeing, the heart is for hearing
September 15, 2022
Abstract
Heart rate variability (HRV) is the variation in the time period between consecutive heart beats and can provide an objective measure of physical and mental health status. This post will provide a general overview of *why*, *when*, and *how* you can use heart rate variability or HRV monitoring to gain insights in the effects of various physical, mental and environmental factors on your well-being.
Date
September 15, 2022
Time
12:00 AM
What is heart rate variability or HRV?
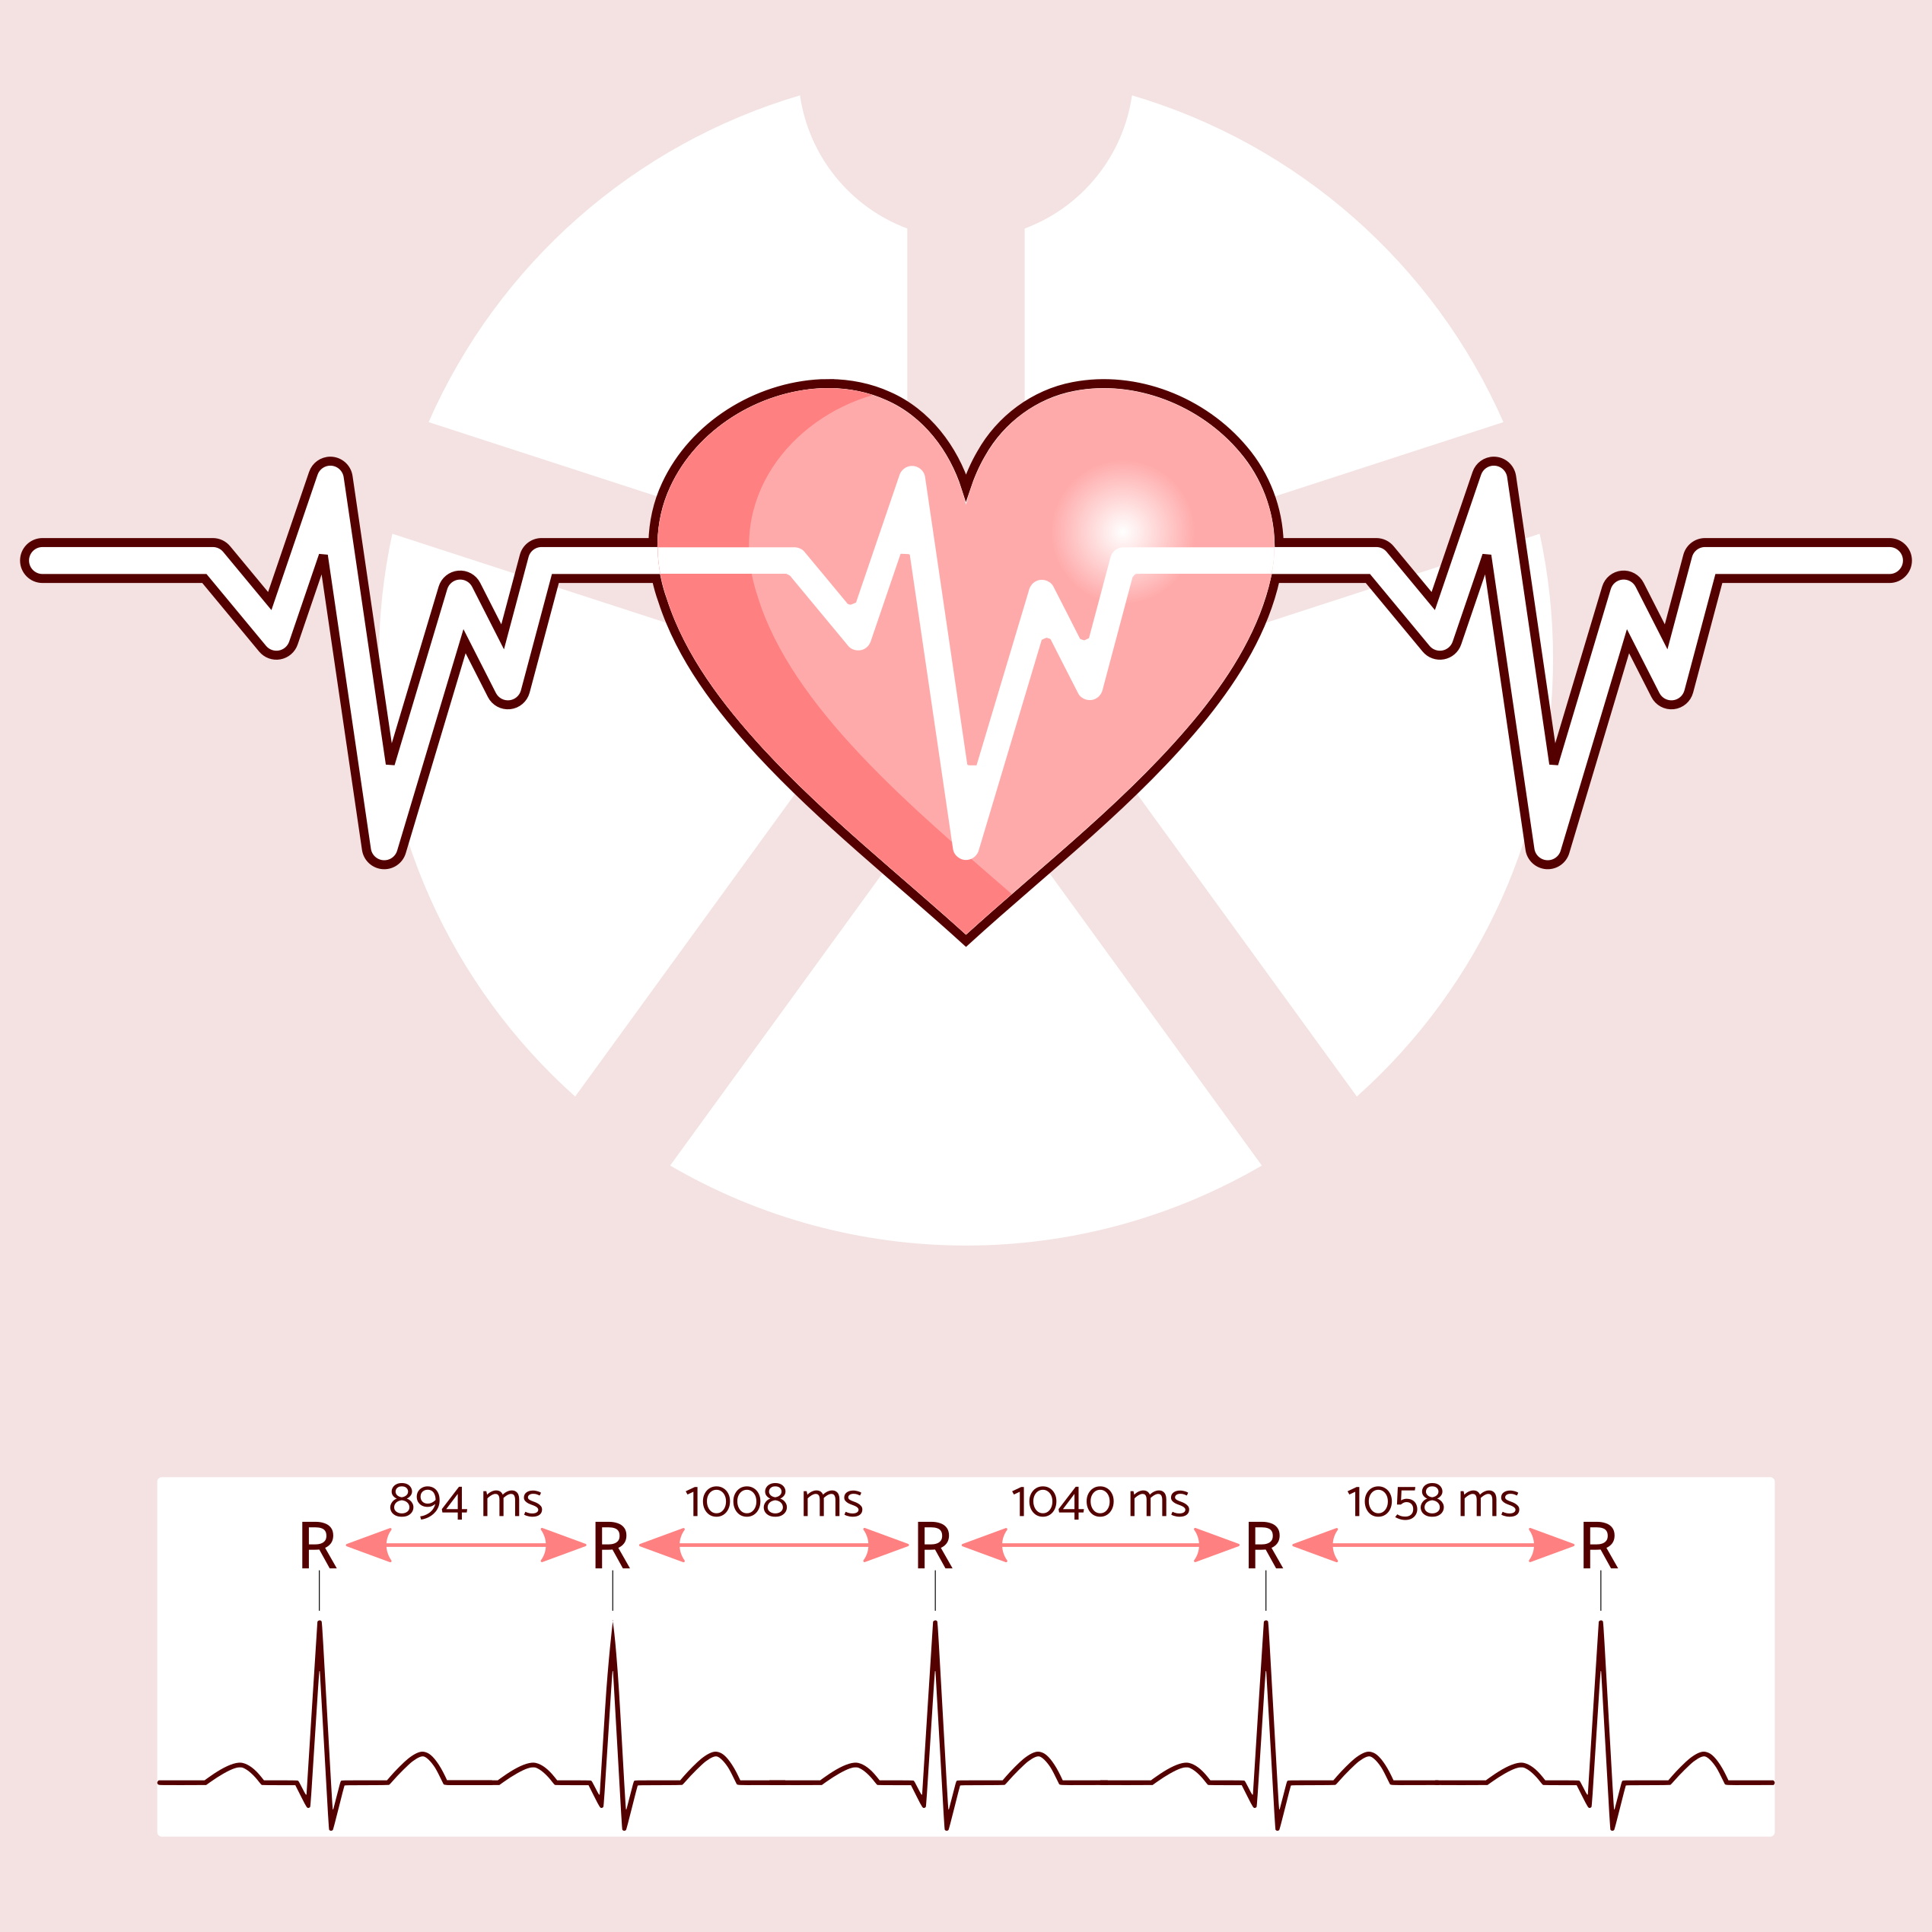
Heart rate variability is not the same as heart rate. A heart rate of 60 beats per minute means that there is on average 1 second (or 1000 ms) between two consecutive heart beats. However, the actual time between each heart beat will not be exactly 1000 ms, but will vary above and below this average value (Figure 1). For example, just the simple process of breathing causes an increase in heart rate with every inhale, whereas every exhale causes a decrease in heart rate. The extent to which the heart rate fluctuates is the heart rate variability or HRV.
Heart rate variability is calculated by measuring the time between two consecutive heart beats. This time period is named the R-to-R or interbeat interval (IBI). The R in the R-R interval refers to the moment of maximal electrical impulse during the contraction of the hearts, as measured in an electrocardiogram or ECG (Figure 2).
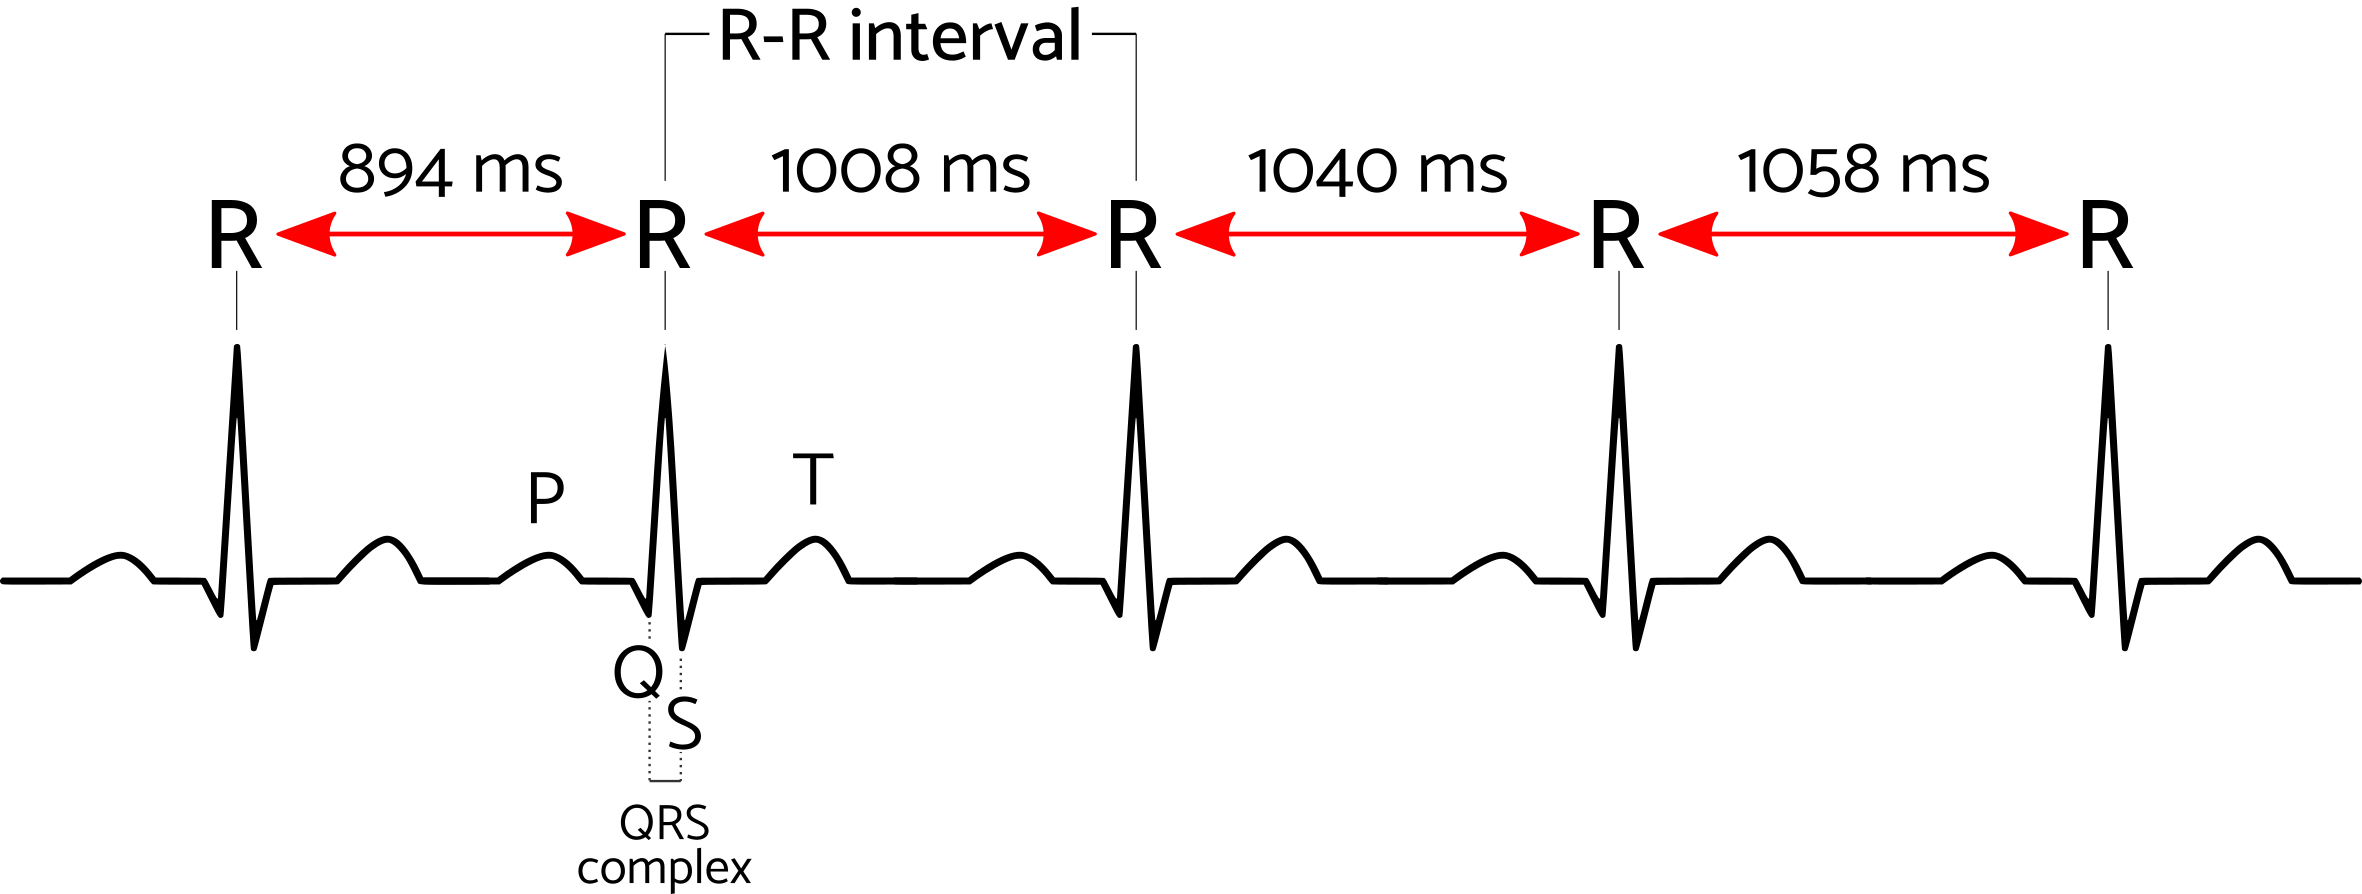
You may sometimes encounter the N-N interval, which is simply equal to the R-R interval corrected for outliers or measurement errors. The individual R-R (or N-N) intervals are used to compute the heart rate variability. Before discussing the different methods used to calculate HRV, we’ll first discuss why and how to monitor your heart rate variability.
What causes heart rate variability?
Your body is continuously adapting to the ever changing circumstances. You can imagine how your heart rate increases when you suddenly start moving. But your heart rate also responds to processes that happen unconsciously, even when sitting still. It could be as simple as a thought, the digestion of your last meal, sounds or movements around you, or the simple fact that you’re breathing. This variability in your heart’s beating rate is a good sign: it means that your body is doing its work to adapt to all the various internal and external stimuli.
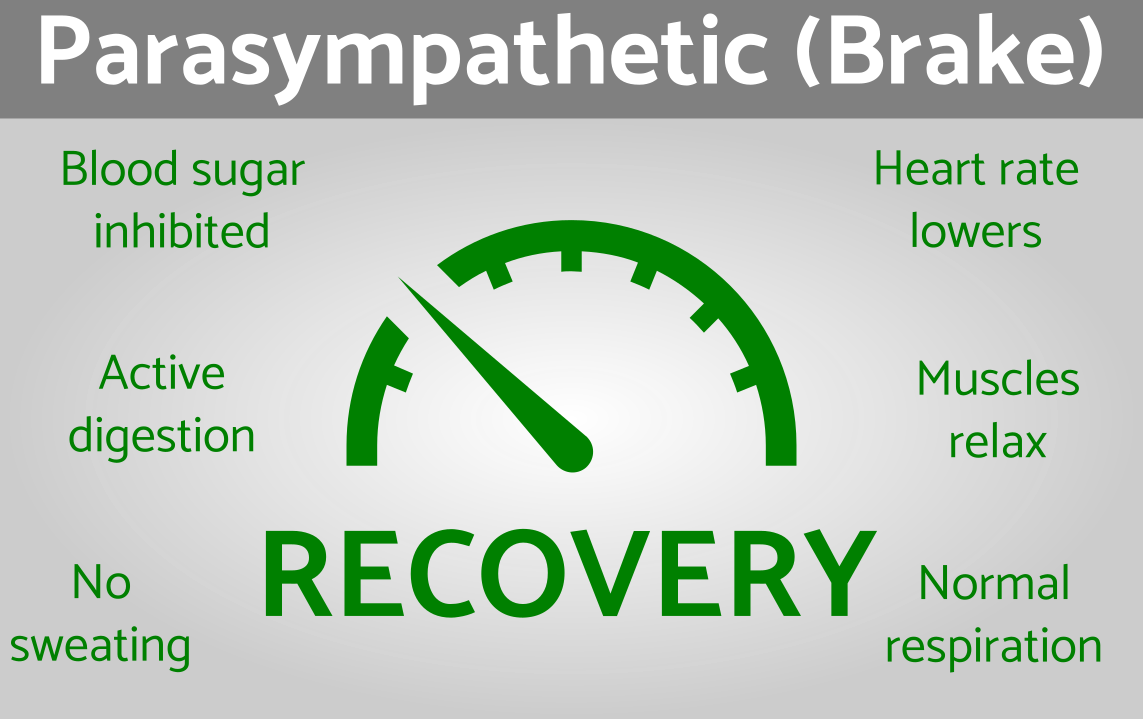
The changes in heart rate are controlled by the autonomous nervous system. The autonomous nervous system is the part of the nervous system responsible for almost all processes that don’t need any conscious effort, such as breathing, digestion, blood pressure and heart rate. The autonomous nervous system consists of two branches with an opposite function: the sympathetic and parasympathetic nervous system (Figure 3).
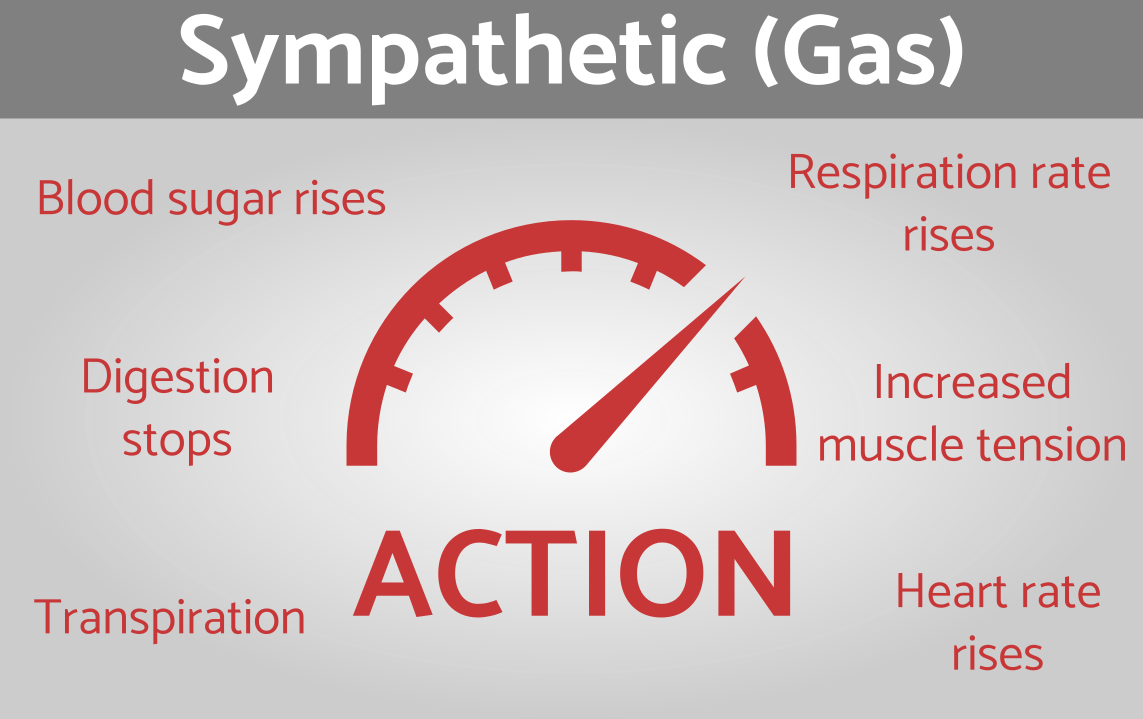
Why measure heart rate variability?
Because the sympathetic and parasympathetic nervous system are active at the same time, with an opposite effect on heart rate, the variability in heart rate can be used as an objective measure of the balance between sympathetic and parasympathetic activity.
 In general, a higher heart rate variability indicates a better balance between the body’s gas and brake, making the heart better capable to adapt to changes. When the body is under stress (either physically or mentally) the capacity of the heart to adapt to different stimuli decreases, reflected by a lower heart rate variability or HRV. Monitoring heart rate variability or HRV can, therefore, provide insights in your body’s response to stress.
Athletes, for example, use HRV to measure the body’s response to training load and to signal the need for recovery. Monitoring long-term trends in HRV can also aid to discover which habits or lifestyle changes have a positive or negative effect on HRV, e.g., in- or exclusion of certain nutrition, drinken (too much) alcohol, changes in living environment, a good or bad night sleep, and more or less stressful periods. A rise in HRV may indicate a positive effect of the lifestyle changes on your overall fitness - and that will defenitely motivate to keep up! Another application of HRV is in biofeedback, where HRV is monitored in real-time during, for example, meditation, deep breathing, or treatment of stress and burnout. As relaxation results in an increased parasympathetic activity and consequent rise in HRV, the biofeedback lets you know you’re on the right track and helps you learn how to better relax.
How to monitor heart rate variability?
Heart rate variability is relatively easy to measure. Nowadays various commercially available heart rate monitors can measure HRV as long as they record every heart beat as well as the corresponding R-R or IBI interval. Smartphone apps, such as those from EliteHRV or HRV4Training, allow immediate HRV readings either by measuring heart rate through the phone’s built-in camera or by connecting to a heart rate monitor that records individual heart beats.
R-R intervals can be measured with both electrical and optical heart rate monitors (Figure 4). Chest straps record the heart rate based on the heart’s electrical impulse and are typically more accurate for HRV measurements. Optical sensors, such as commonly used in heart rate monitors worn on the wrist, finger or ear, measure heart rate through photoplethysmography (PPG). PPG uses a light sensor to estimate the blood’s volume as a measure for heart rate. An advantage of optical heart rate monitors is their ease of use. However, optical heart rate sensors are prone to measurement errors, for example caused by motion during the recording.

To allow a comparison of HRV recordings, it is essential to measure HRV under constant conditions. Therefore it is recommended to measure HRV in a supine position at a fixed time of the day, preferably in the morning upon awakening, for at least 1 minute, but between 3-5 minutes for the most accurate result (Table 1). When using HRV to monitor a long-term trend it is furthermore recommended to take at least 3 recordings per week to get an accurate picture of your general, physical and mental health status.
Table 1: Recommendations for recording HRV.
| Optimal | Alternative | |
|---|---|---|
| Sensor: | Electrical | Optical |
| Time: | Upon awakening | Fixed time of day |
| Duration: | 5 minutes | At least 1 minute |
| Position: | Supine | Seated |
| Breathing: | Unpaced, natural rhythm | Paced, natural rhythm |
| Frequency: | Every day | At least 3 times a week |
How to analyze heart rate variability?
The definition of variability can be explained, and hence calculated, in various ways.Therefore, you have to be extremely cautious when comparing HRV values from different monitors, apps or studies. There are three main approaches to calculate HRV: the time domain, the frequency domain and the non-linear analysis (Figure 5). The most suitable method depends on what you want to measure exactly as well as on the quality and amount of available data.
HRV in the Time domain
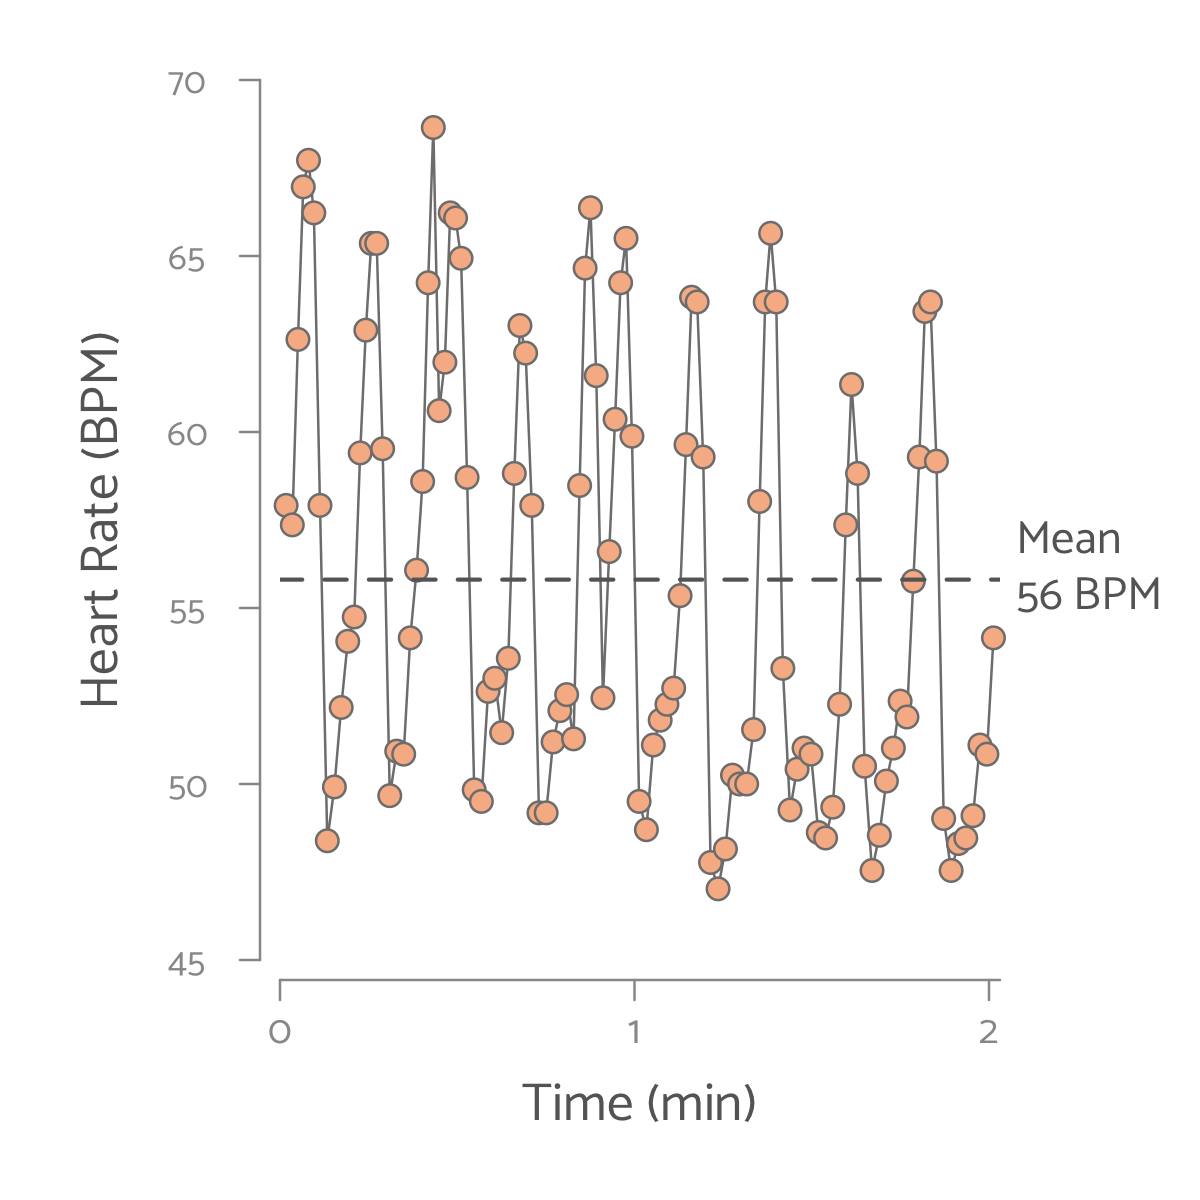
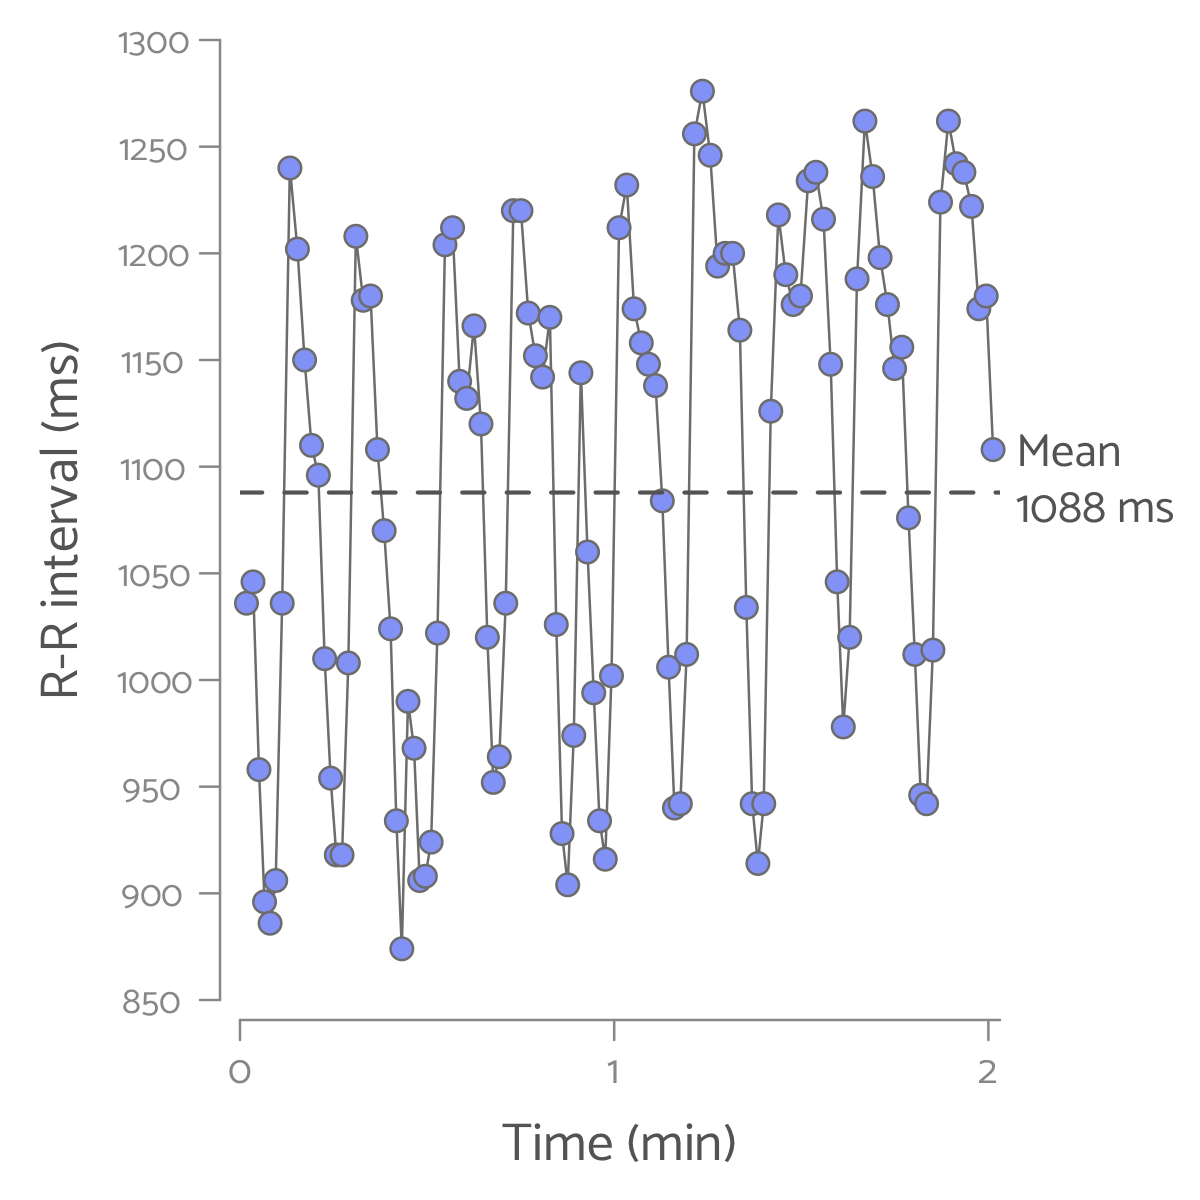
The analysis of heart rate variability in the time domain is most intuitive as it is straightforward to visualize how heart rate continuously changes over time (Figure 6). But how to express the amount of variability as an (objective) value?
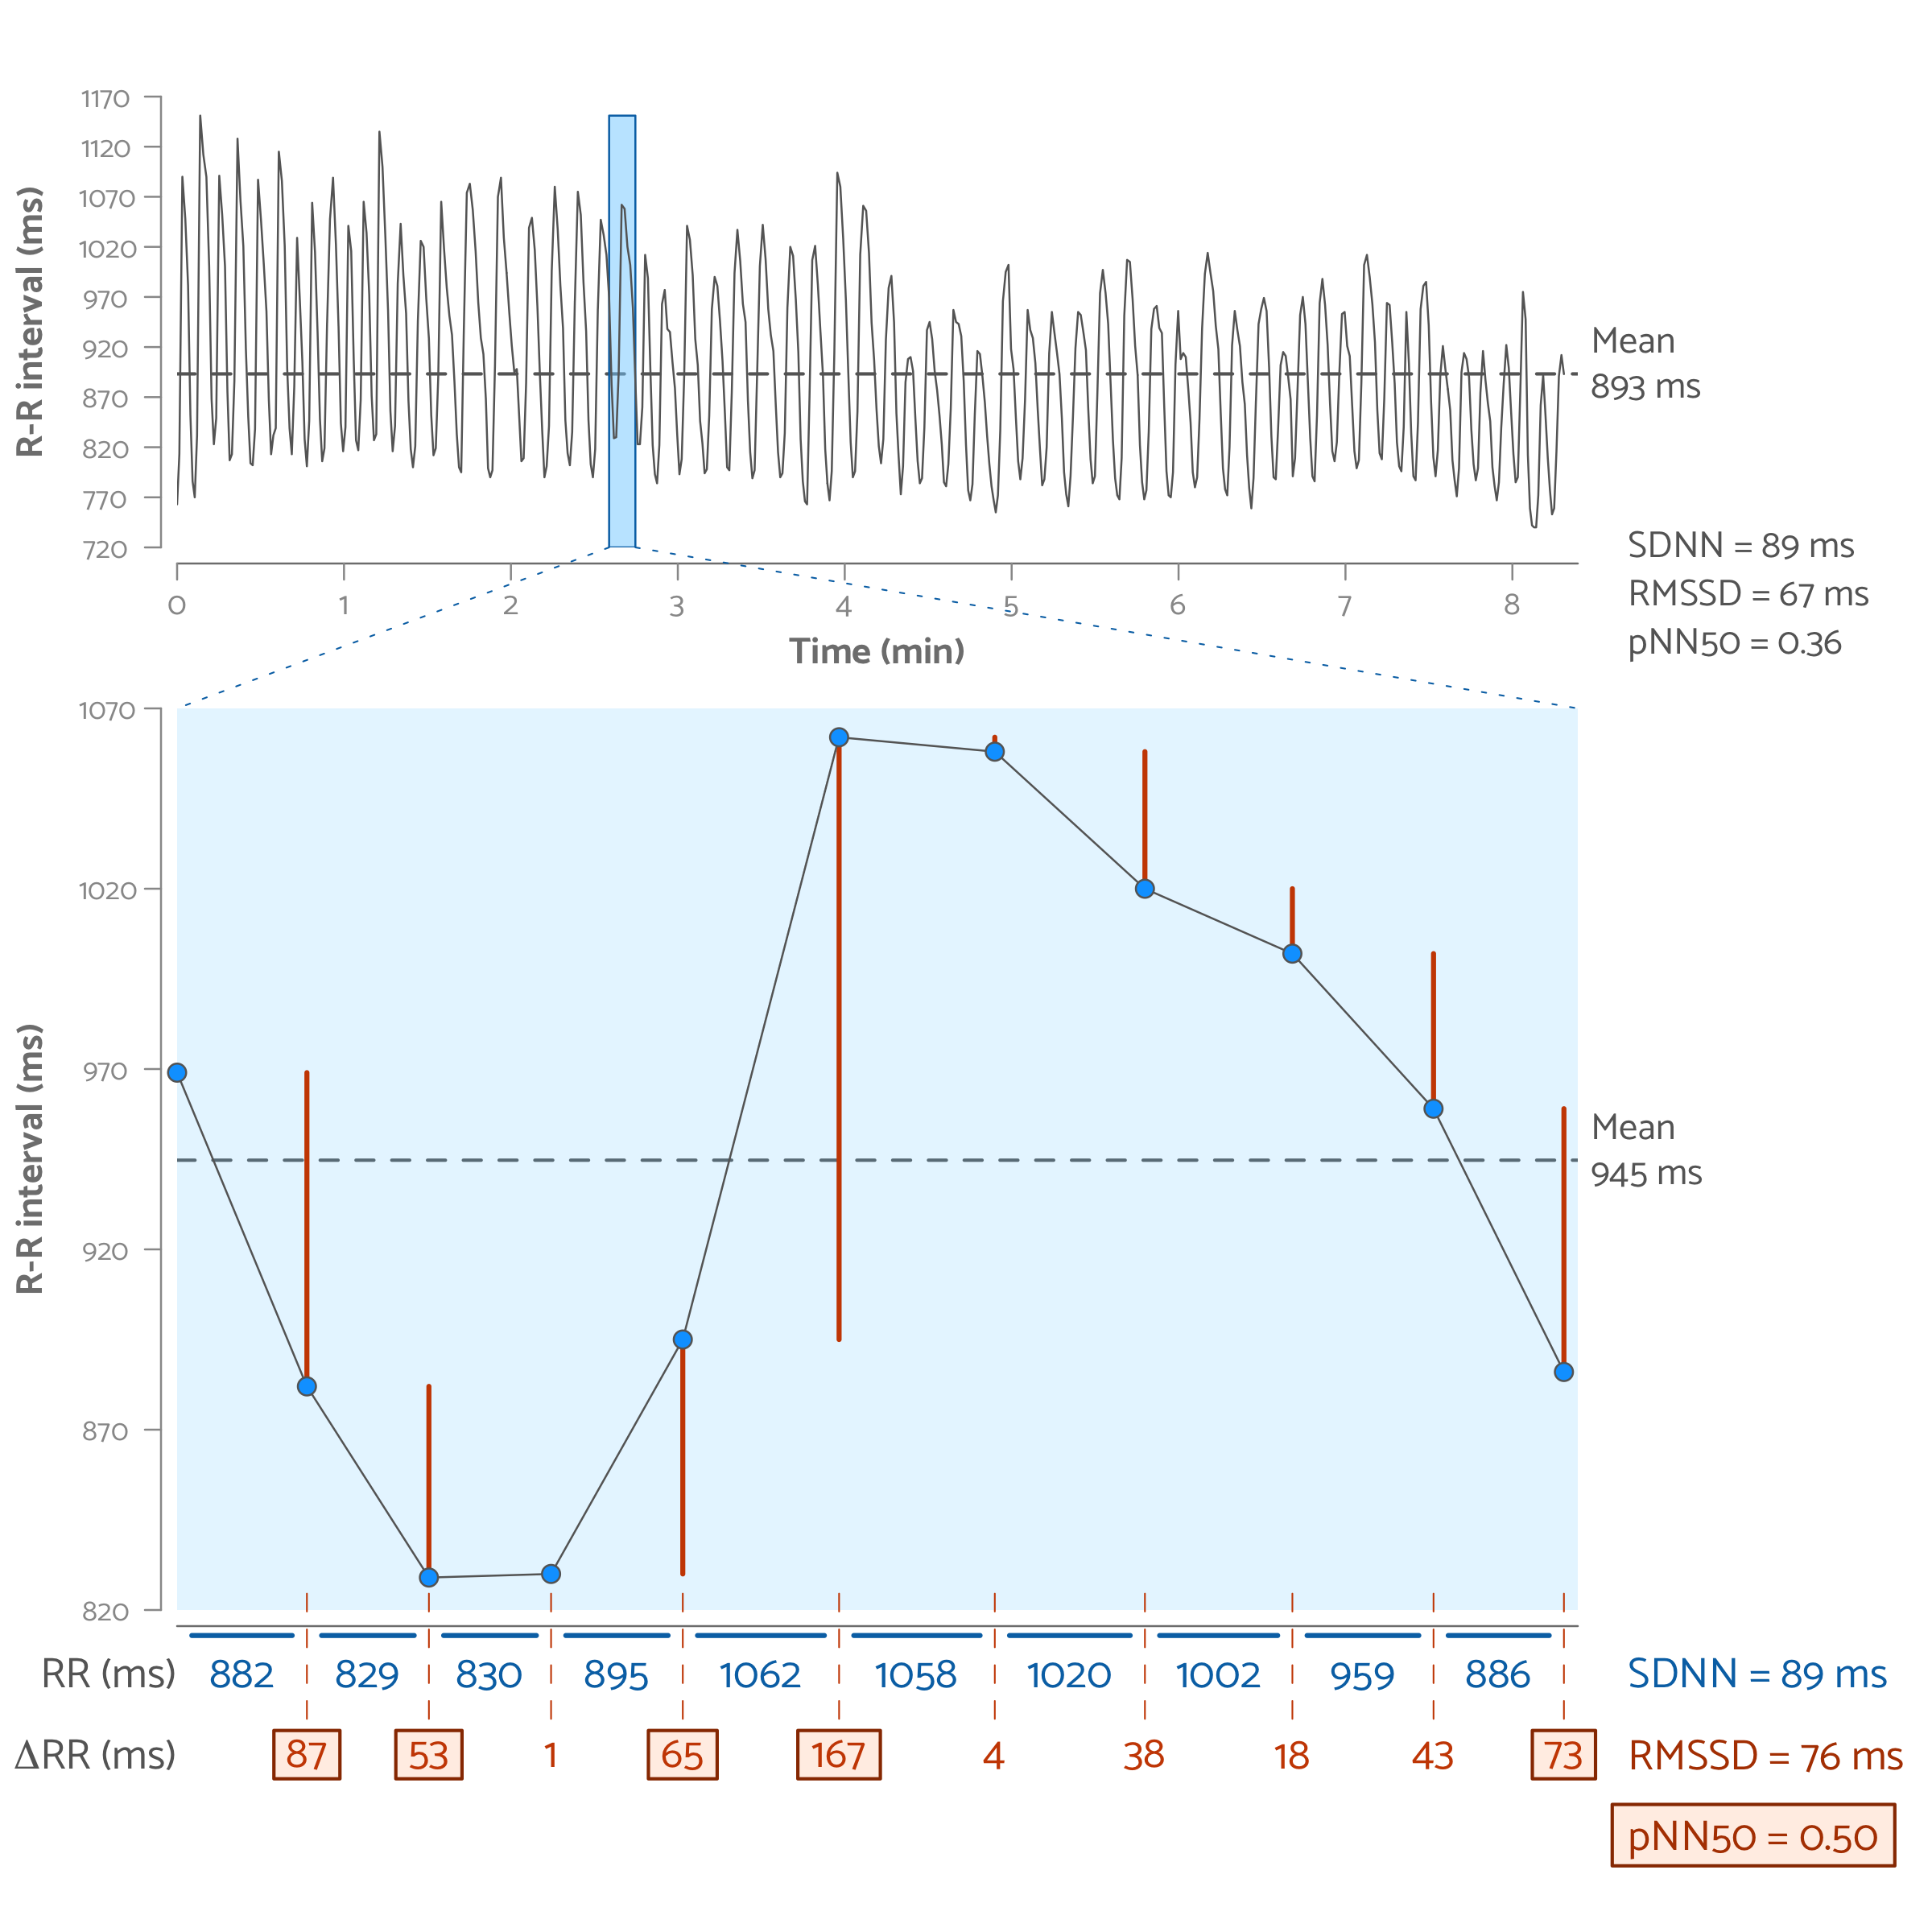
Heart rate variability in the time domain can be calculated by statistical methods such as the standard deviation or by geometric methods based on the size and shape of mutual relations such as a histogram or Poincaré plot (Table 2).
Table 2: HRV measures in the time domain [1]
| Parameter | Unit | Description |
|---|---|---|
| SDNN | ms | Standard Deviation of NN intervals |
| SDRR | ms | Standard Deviation of RR intervals |
| SDANN | ms | Standard Deviation of the Average NN intervals calculated over short periods |
| SDNN index | ms | Mean of the Standard Deviations of all windowed NN (RR) intervals |
| pNN50 | % | Proportion of successive NN (RR) intervals that differ by more than 50 ms |
| HR Max - HR Min | bpm | Average difference between the highest and lowest heart rate per breath |
| RMSSD | ms | Root Mean Square of Successive Differences in NN (RR) intervals |
| triRR | The area of the RR interval histogram divided by the height | |
| TINN | ms | Baseline width of the RR interval histogram |
Statistical methods for HRV in the time domain
SDNN
The SDNN calculates the standard deviation of the NN interval. Using the SDNN as a measure of HRV is suitable for both short (1-5 minutes) and long (24-hours) HRV measurements. The SDANN first calculates the average NN interval over a fixed, short period (typically 5 minutes) en then uses the standard deviation of these average values as the measure for HRV. The SDNN index does exactly the opposite: first the standard deviation in NN intervals is calculated over fixed, short-term periods and then the average of these standard deviations is used as a measure for HRV.
RMSSD
RMSSD stands for the Root Mean Square of Successive Differences in NN (RR) intervals. The main difference with the SDNN is that the RMSSD is not calculated over the difference of successive heart beast, but over the difference between successive RR intervals (ΔRR). Therefore, the RMSSD is less influenced by short-term variations in HRV than the SDNN, which makes the RMSSD one of the preferred measures for HRV in short-term HRV measurements (1-5 mins).
NN50
The NN50 reflects the variability in heart rate as the total number of successive NN intervals with a difference greater than the 50ms threshold. The pNN50, on the other hand, reflects the percentage NN intervals with a difference greater than 50ms and is calculated as the NN50 divided by the total number of NN intervals.
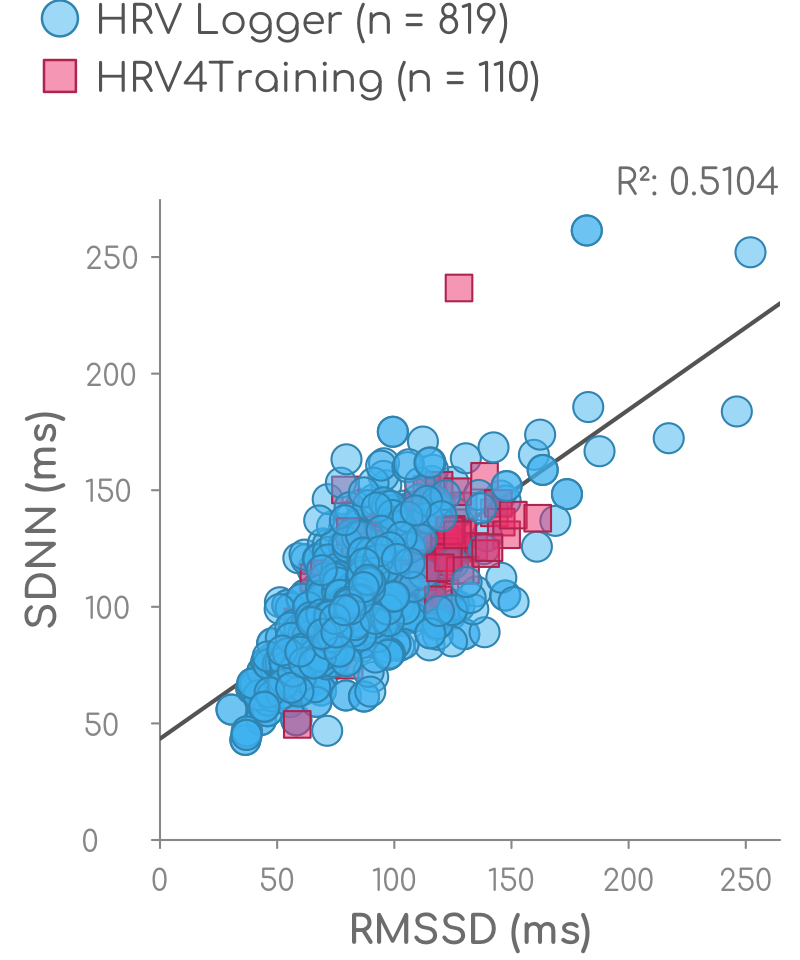
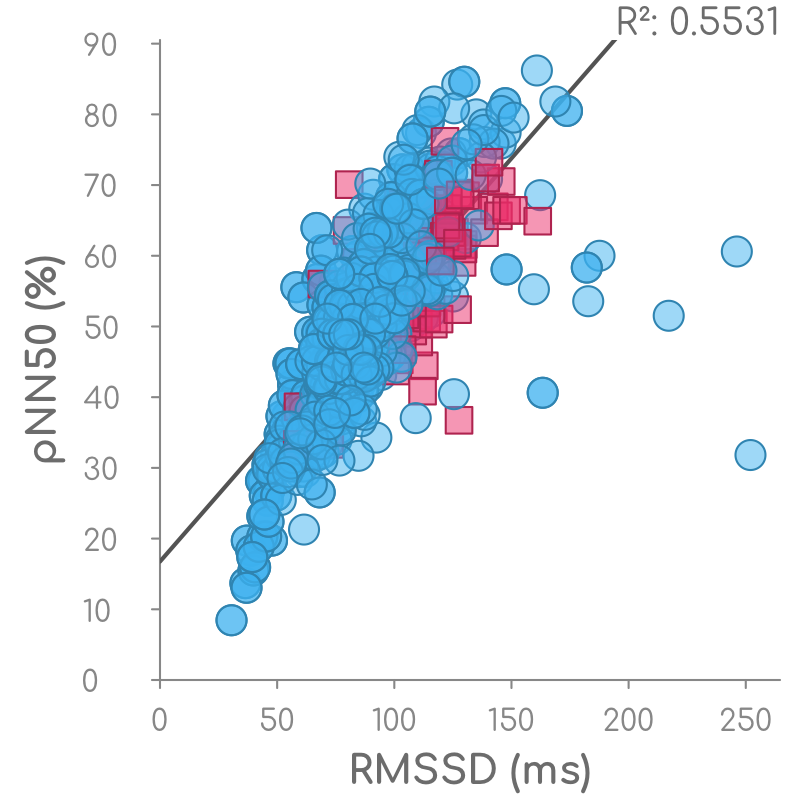
Calculating the SDNN, RMSS or pNN50 from the same HRV measurement will provide completely different HRV measures. For example, the measurement representd in Figure 6 gives and HRV of 89ms using SDNN, 67ms using RMSSD and of 36% using the pNN50. Therefore, it is impossible to compare HRV values calculated according to different approaches. However, as these methods in the Time Domain all use the RR interval as the basis, a higher value with one method, typically corresponds to a higher value using the other method (Figure 7).
Geometric methods for HRV in the time domain
Geometric methods for HRV measurement are based on the conversion of R-R (or N-N) intervals into geometric patterns such as a distribution histogram. Two examples of geometric methods for HRV are the HRV triangular index (TriRR) or the triangular interpolation of NN intervals (TINN). A main advantage of geometric methods is their relative insensitivity to outliers and measurement errors. However, geometric methods require a large number of R-R intervals (at least 20 minutes but preferably 24 hours) to calculate a meaningful HRV and are therefore inappropriate for short-term HRV measurements.
triRR
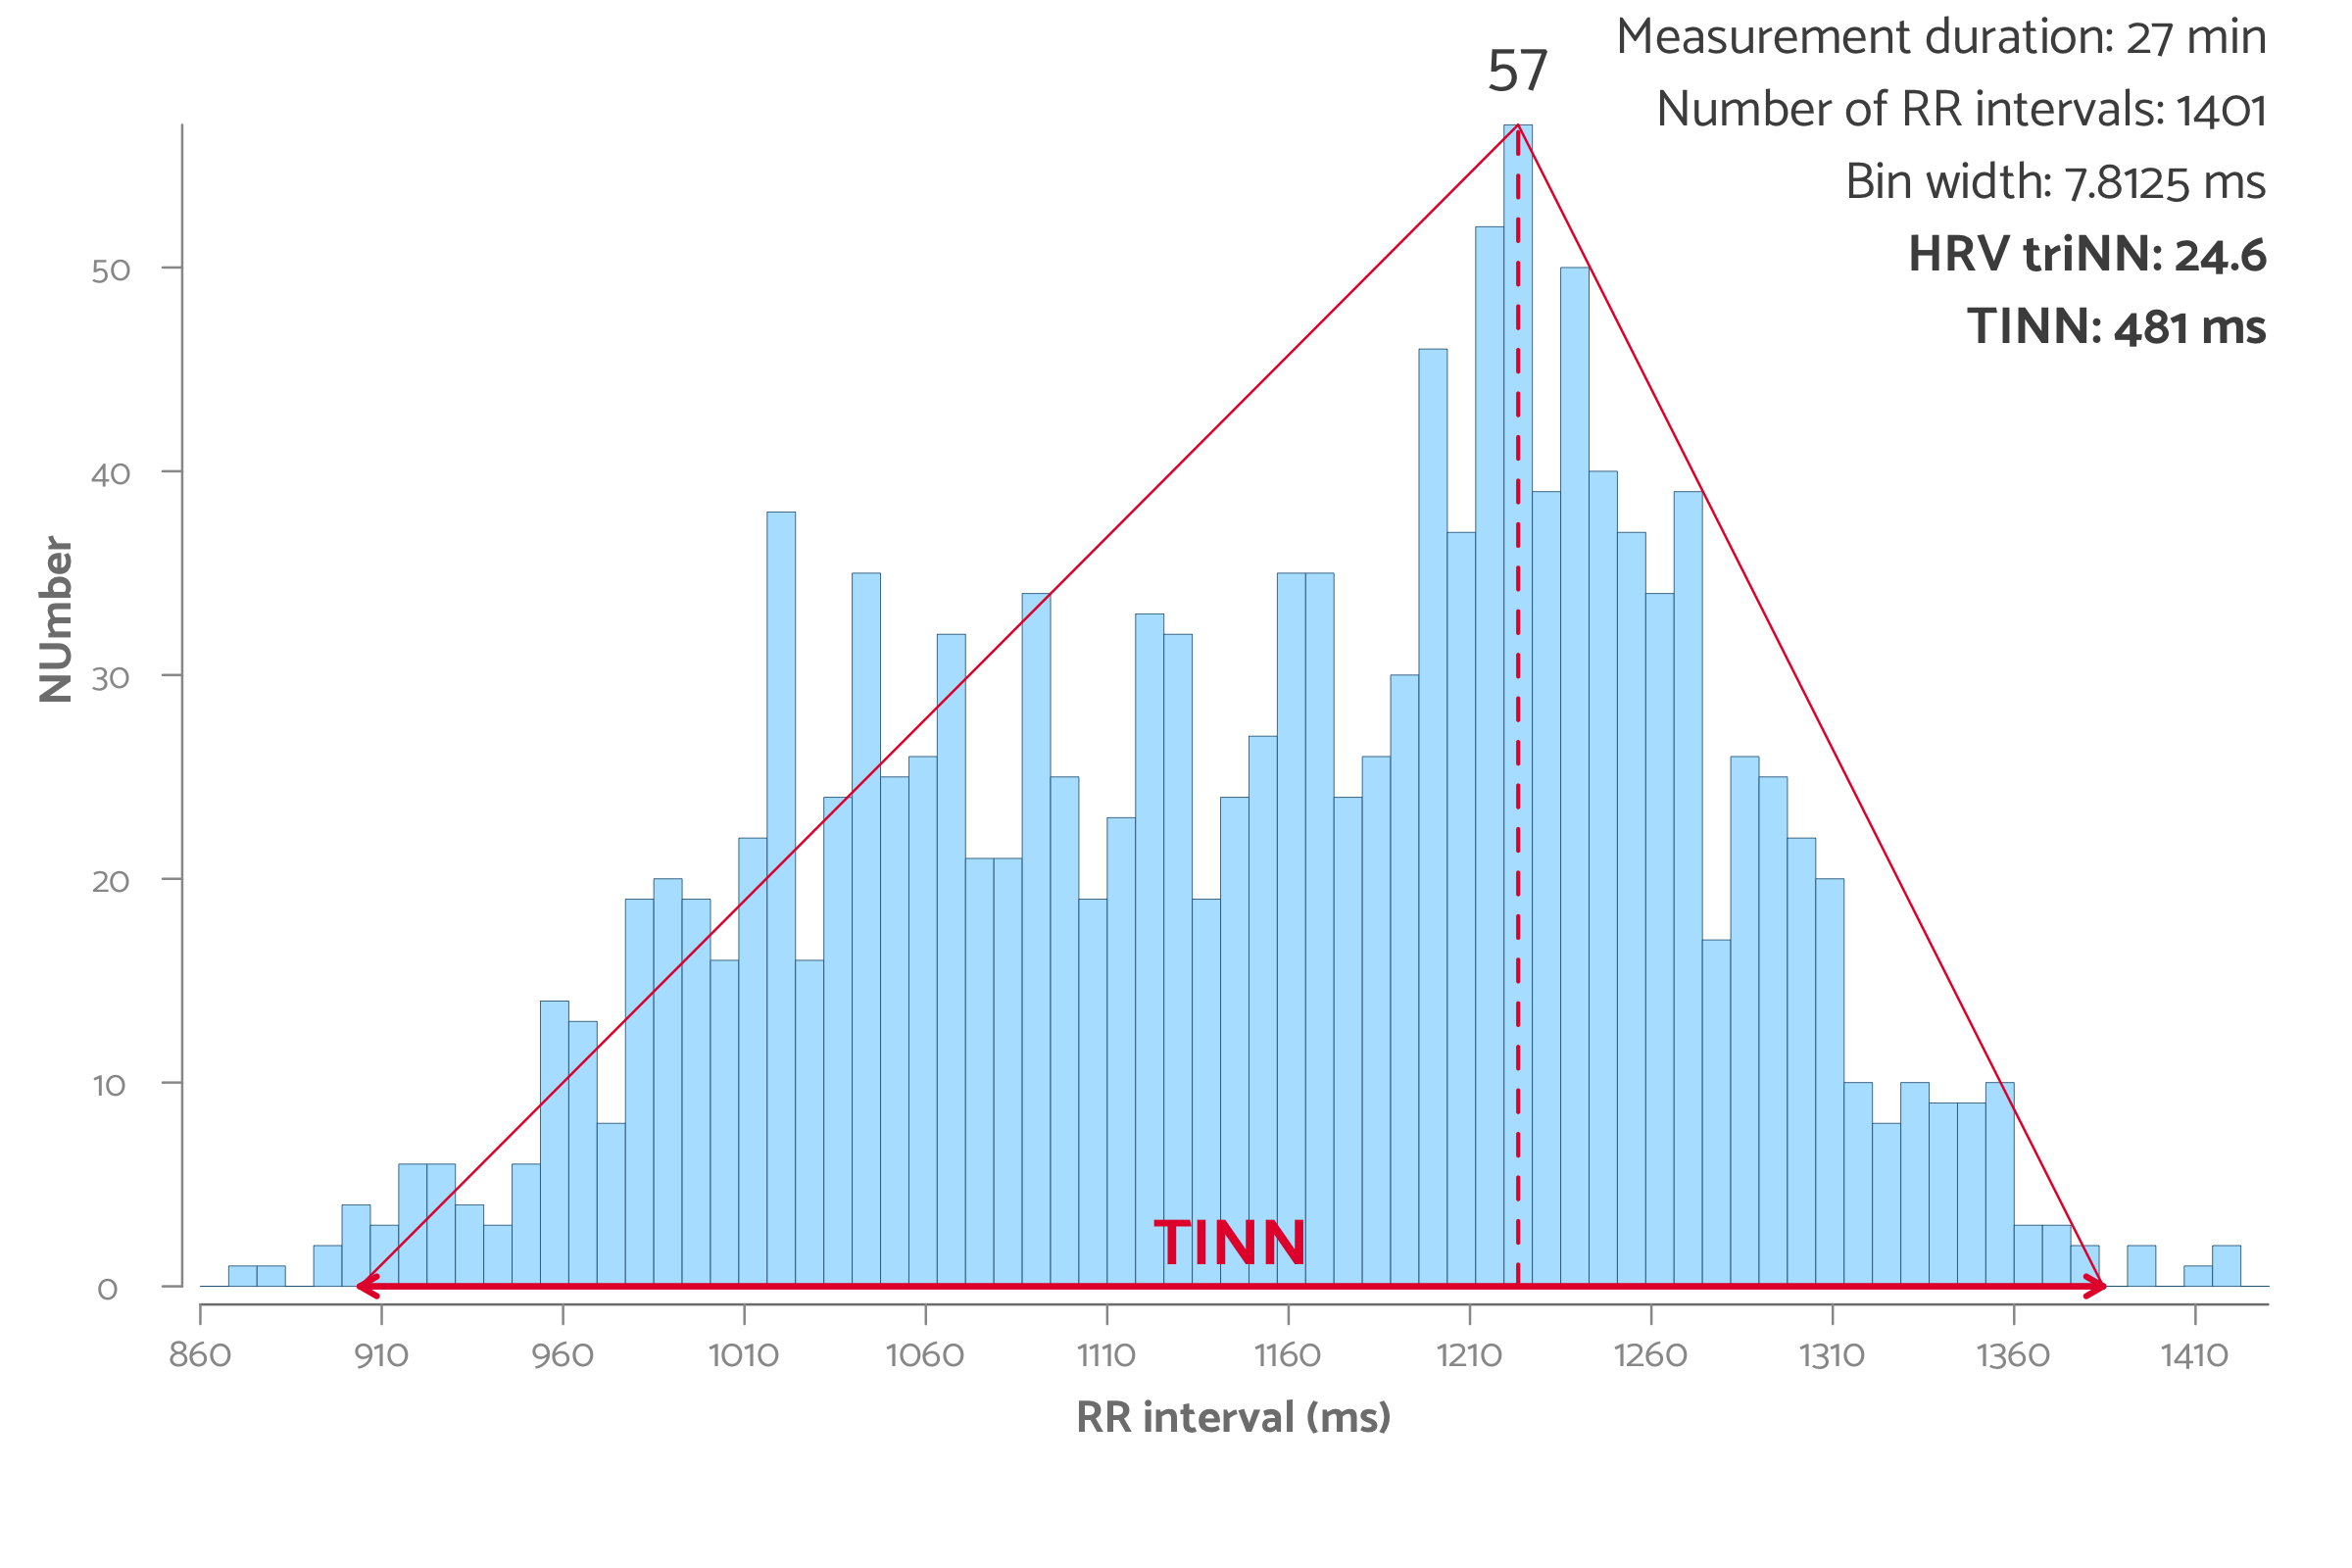
The triRR is the ratio between the area of the R-R interval density distribution (i.e., the total number of R-R intervals) and the maximum of the density distribution. In a histogram, the triRR is approximated by the total number of R-R intervals divided by the number of R-R intervals in the highest bin (Figure 8). Hence, the estimated triRR depends on the selected bin size of the histogram. Typically, the bin size is set to 128 Hz (7.8125 ms), which corresponds to the precision of current commercially available heart rate monitors.
TINN
The triangular interpolation of NN interval histogram (TINN) equals the baseline width of the traingle that can be fit (using the minimum square difference) on the histogram of N-N intervals (Figure 8).
HRV in the Frequency domain
Heart rate is controlled by various bodily processes. Each with their own frequency. Respiration, for example, causes variation in heart rate with a relatively high frequency as multiple breaths per minute cause the heart rate to speed up (with every inhale) and slow down (with very exhale) multiple times per minute. Other processes, such as the circadian rhythm, affect the heart rate with a low, 24 hour, frequency. All these processes together account for the observed heart rate variability (Figure 9).
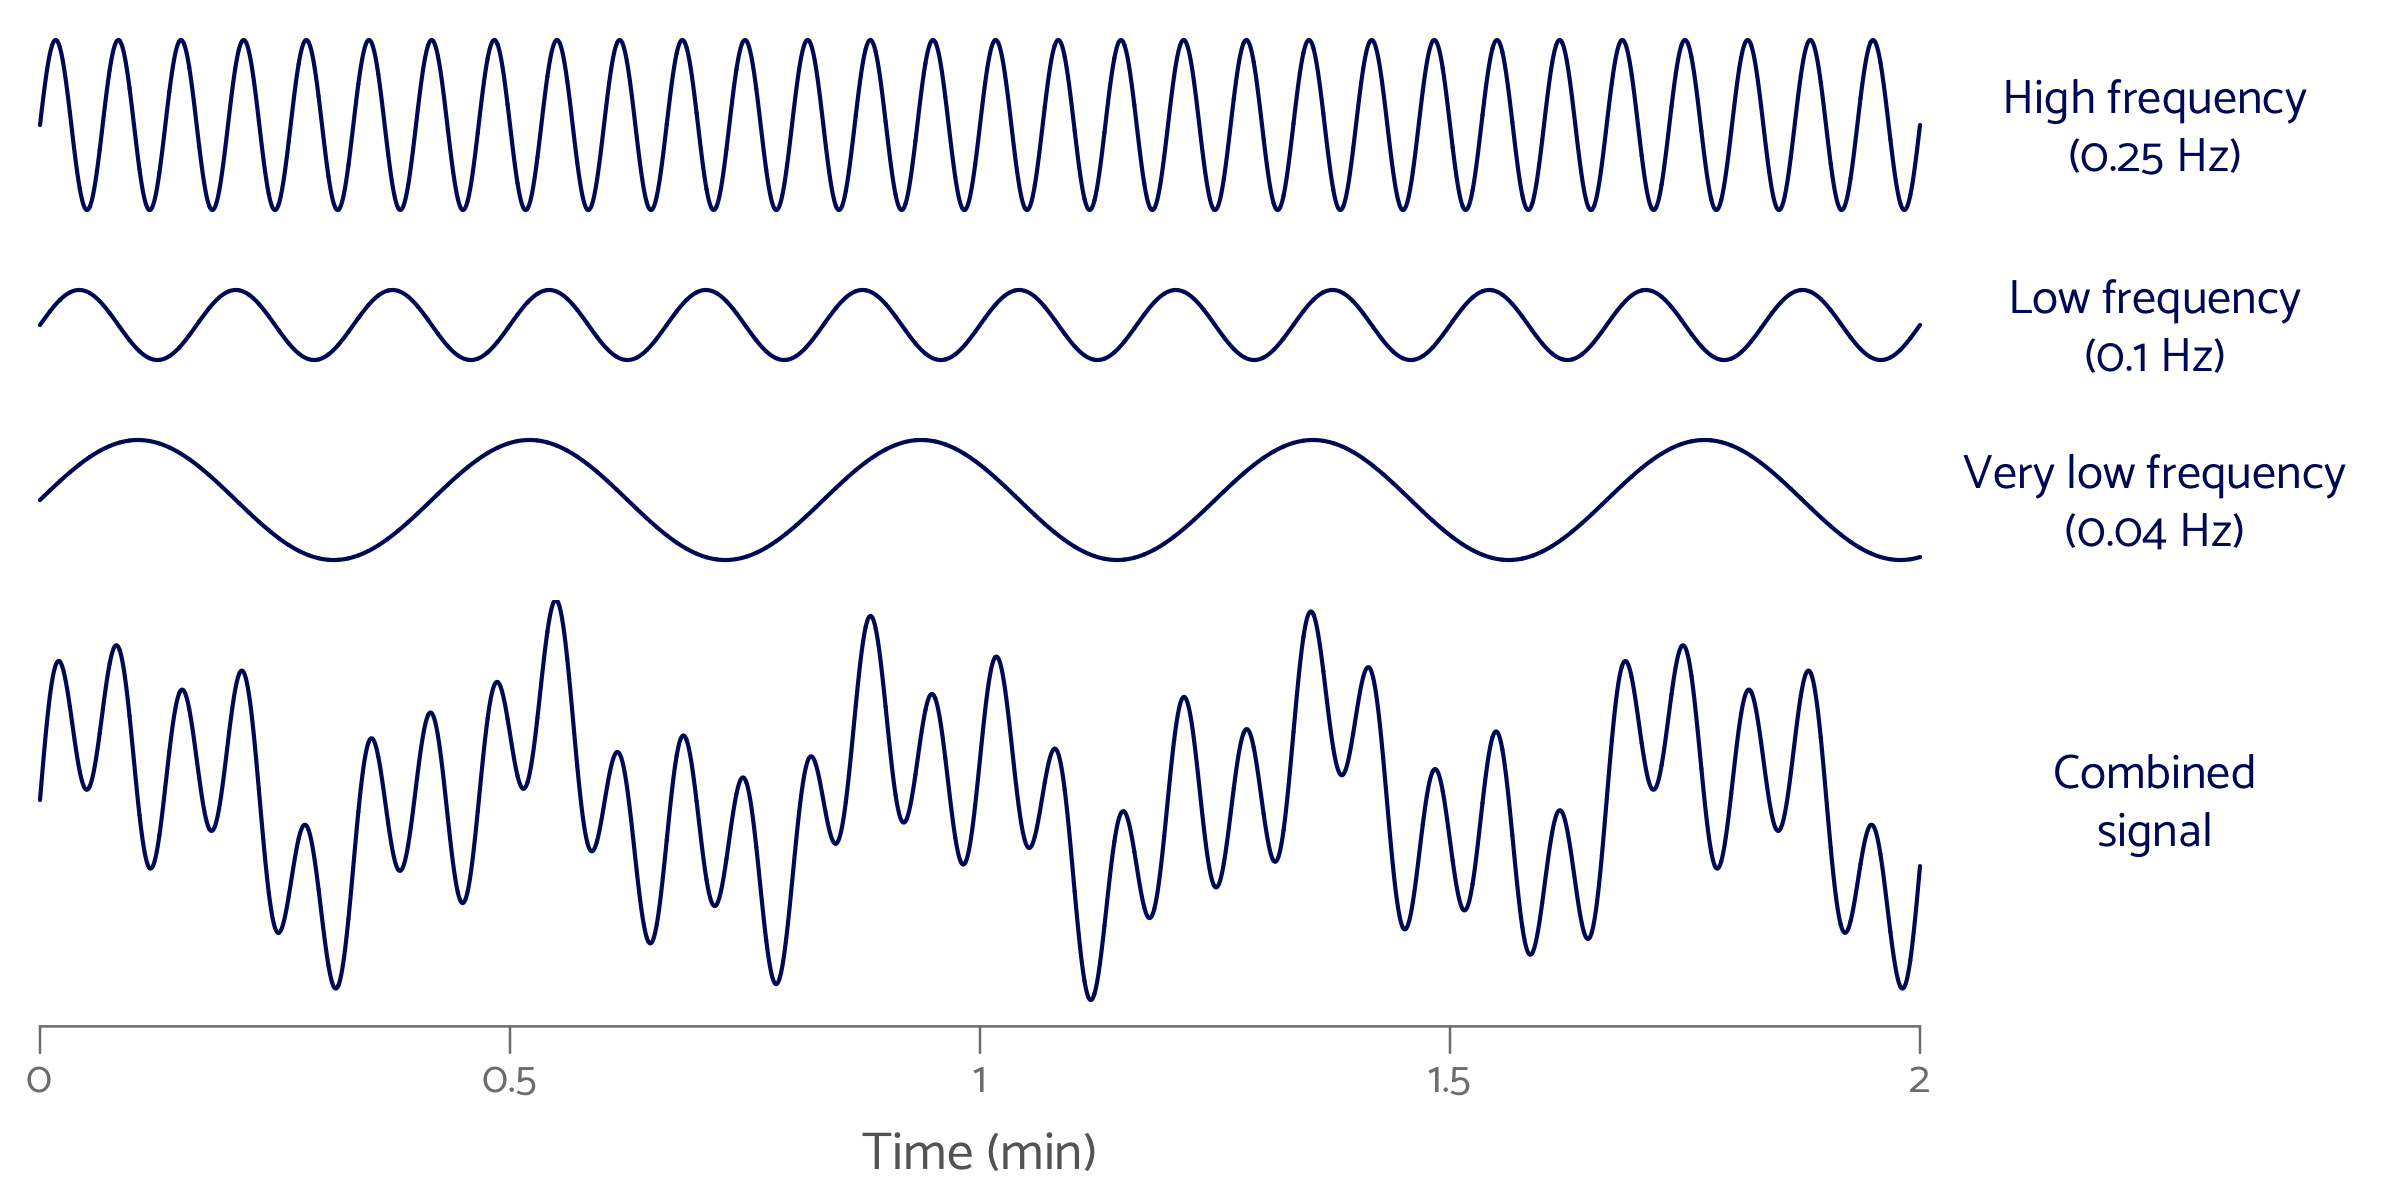
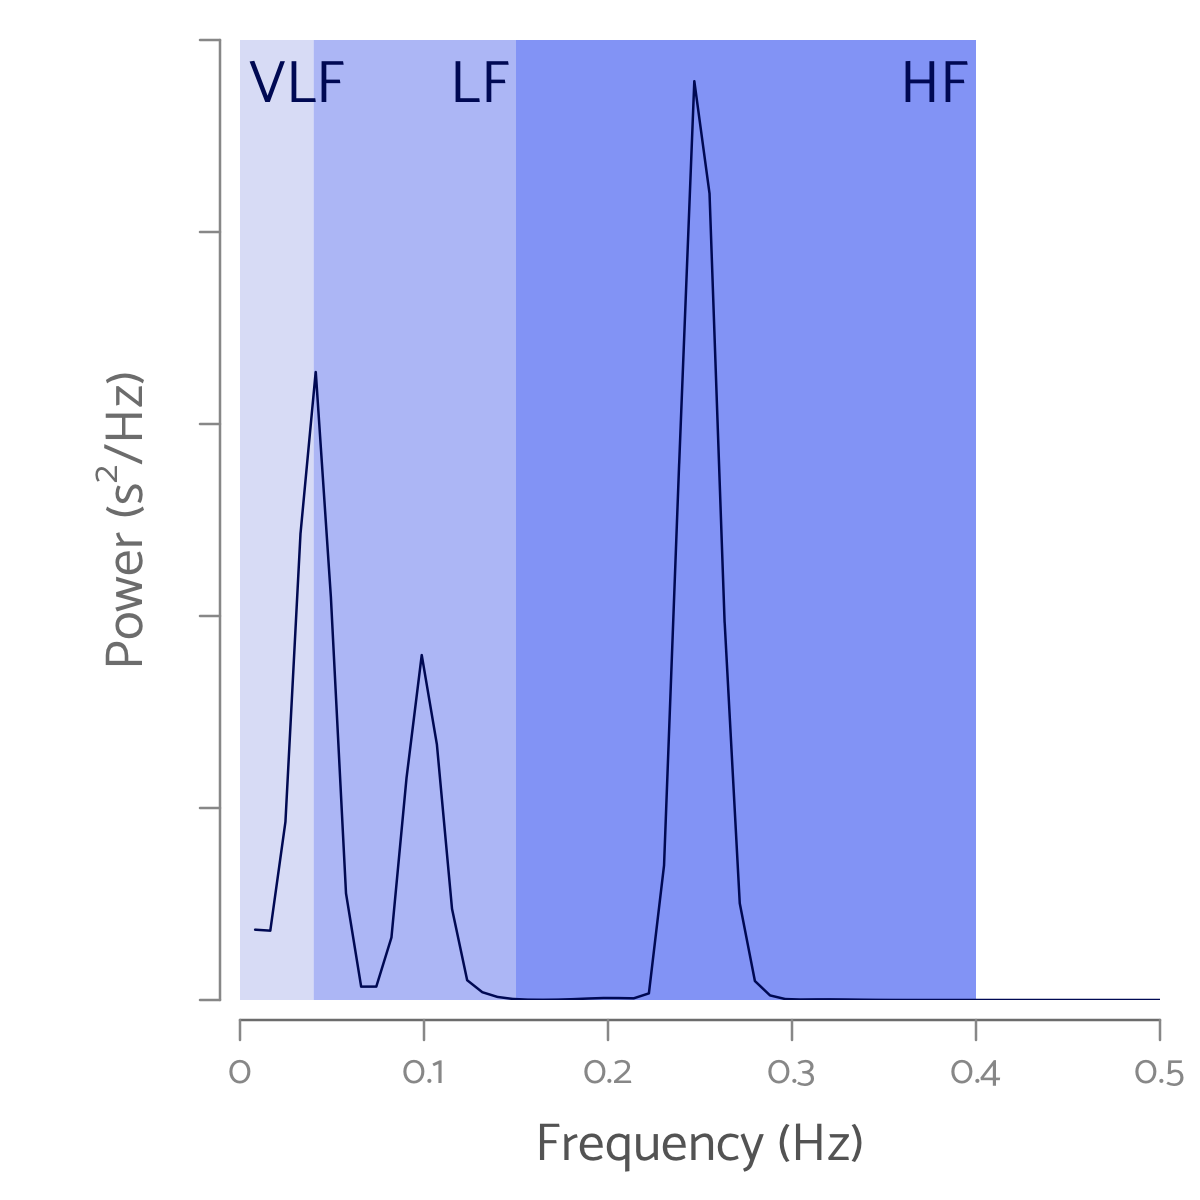
Analysis of HRV in the frequency domain represents the extent to which three different frequency domains account to the observed variation in heart rate: the high frequency (HF), low frequency (LF), and very low frequency (VLF) domains, as visualized in the power-density curve in Figure 10.
High Frequency (HF) band.
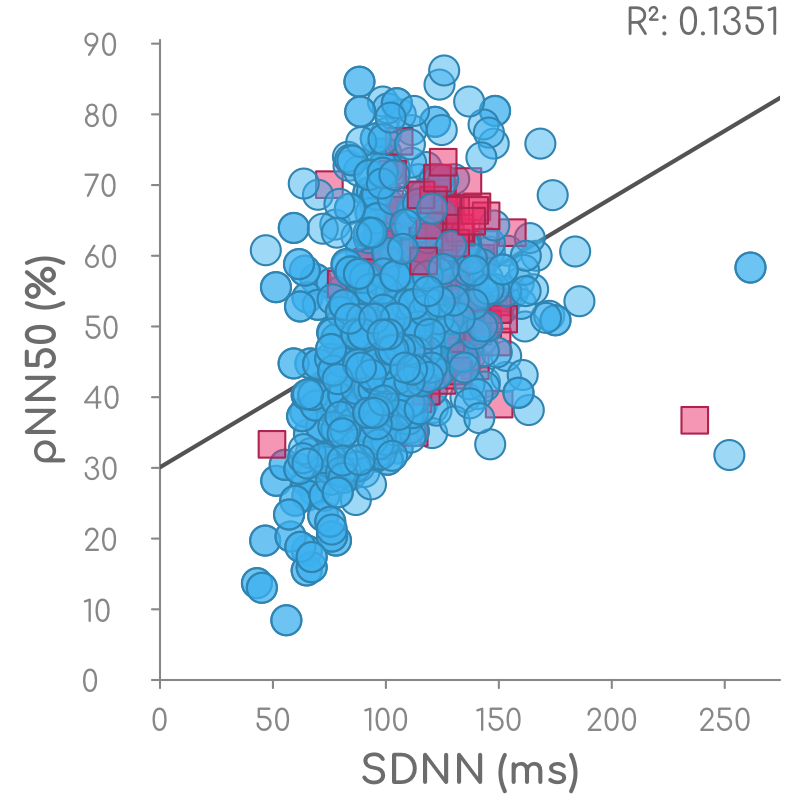
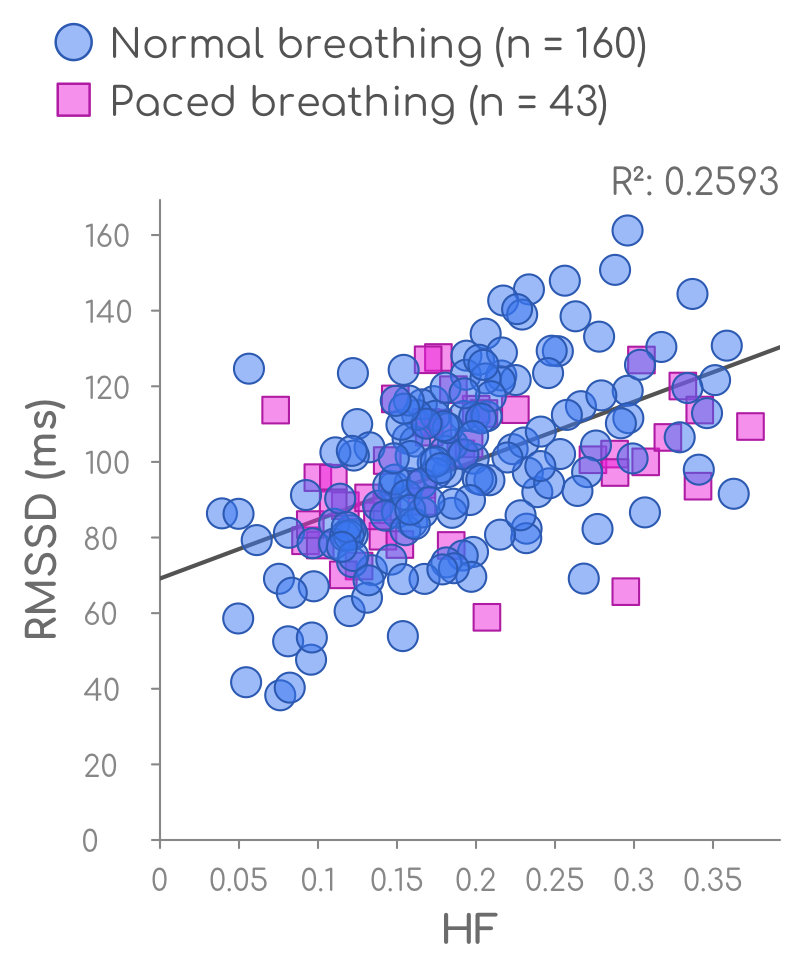
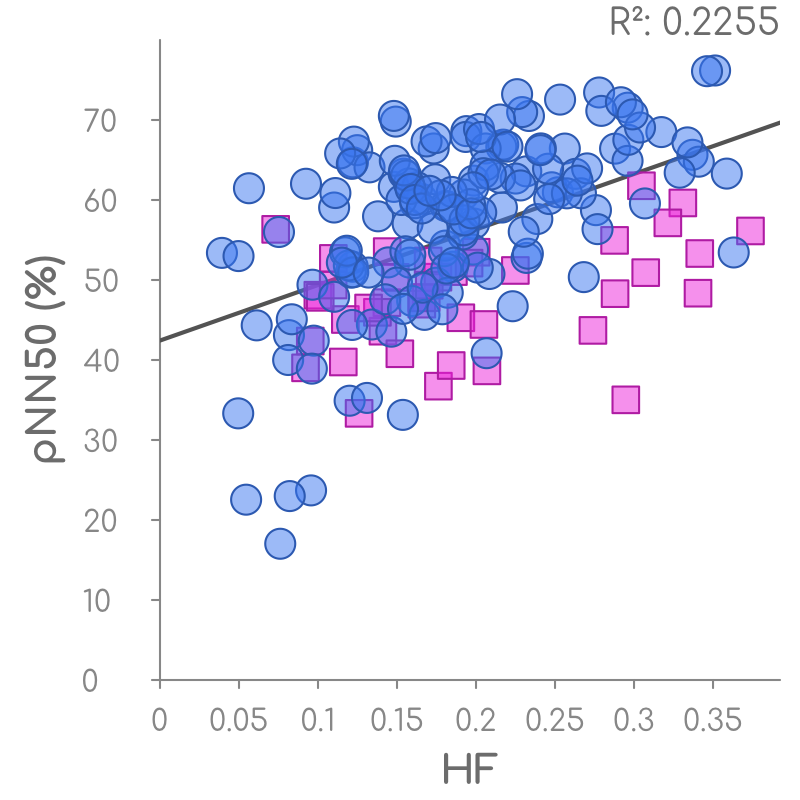
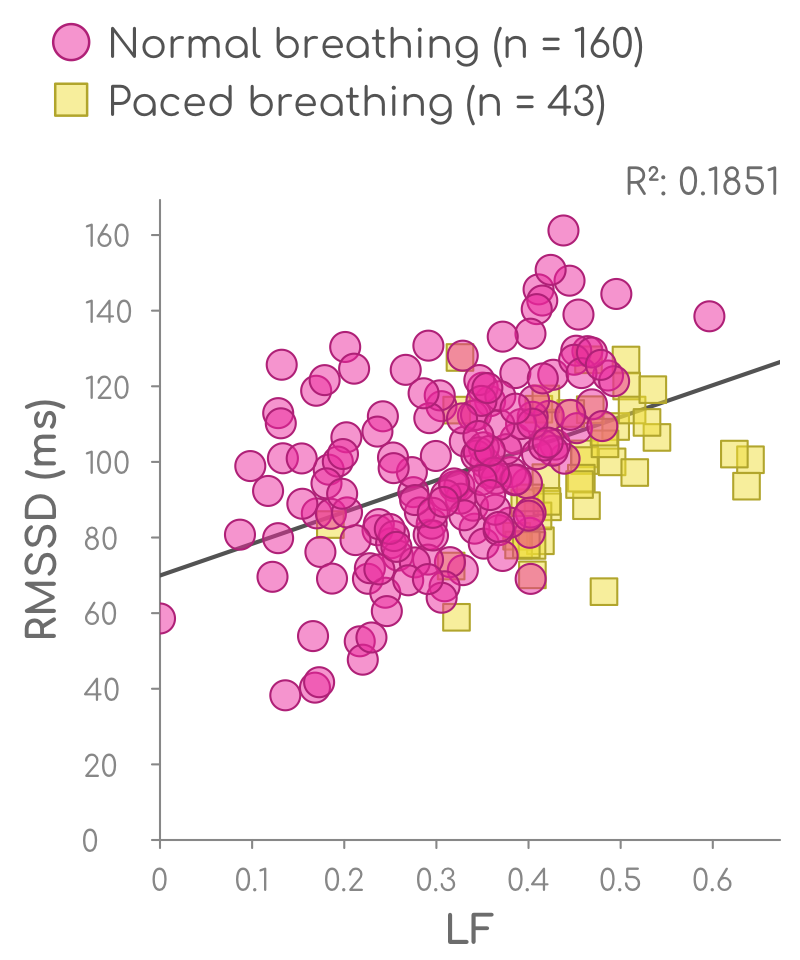
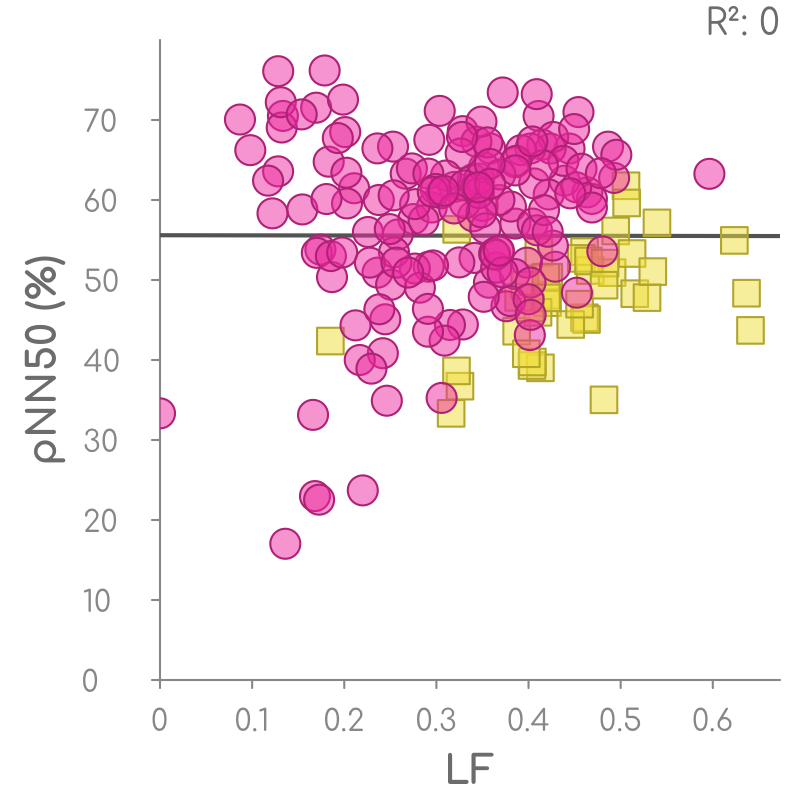
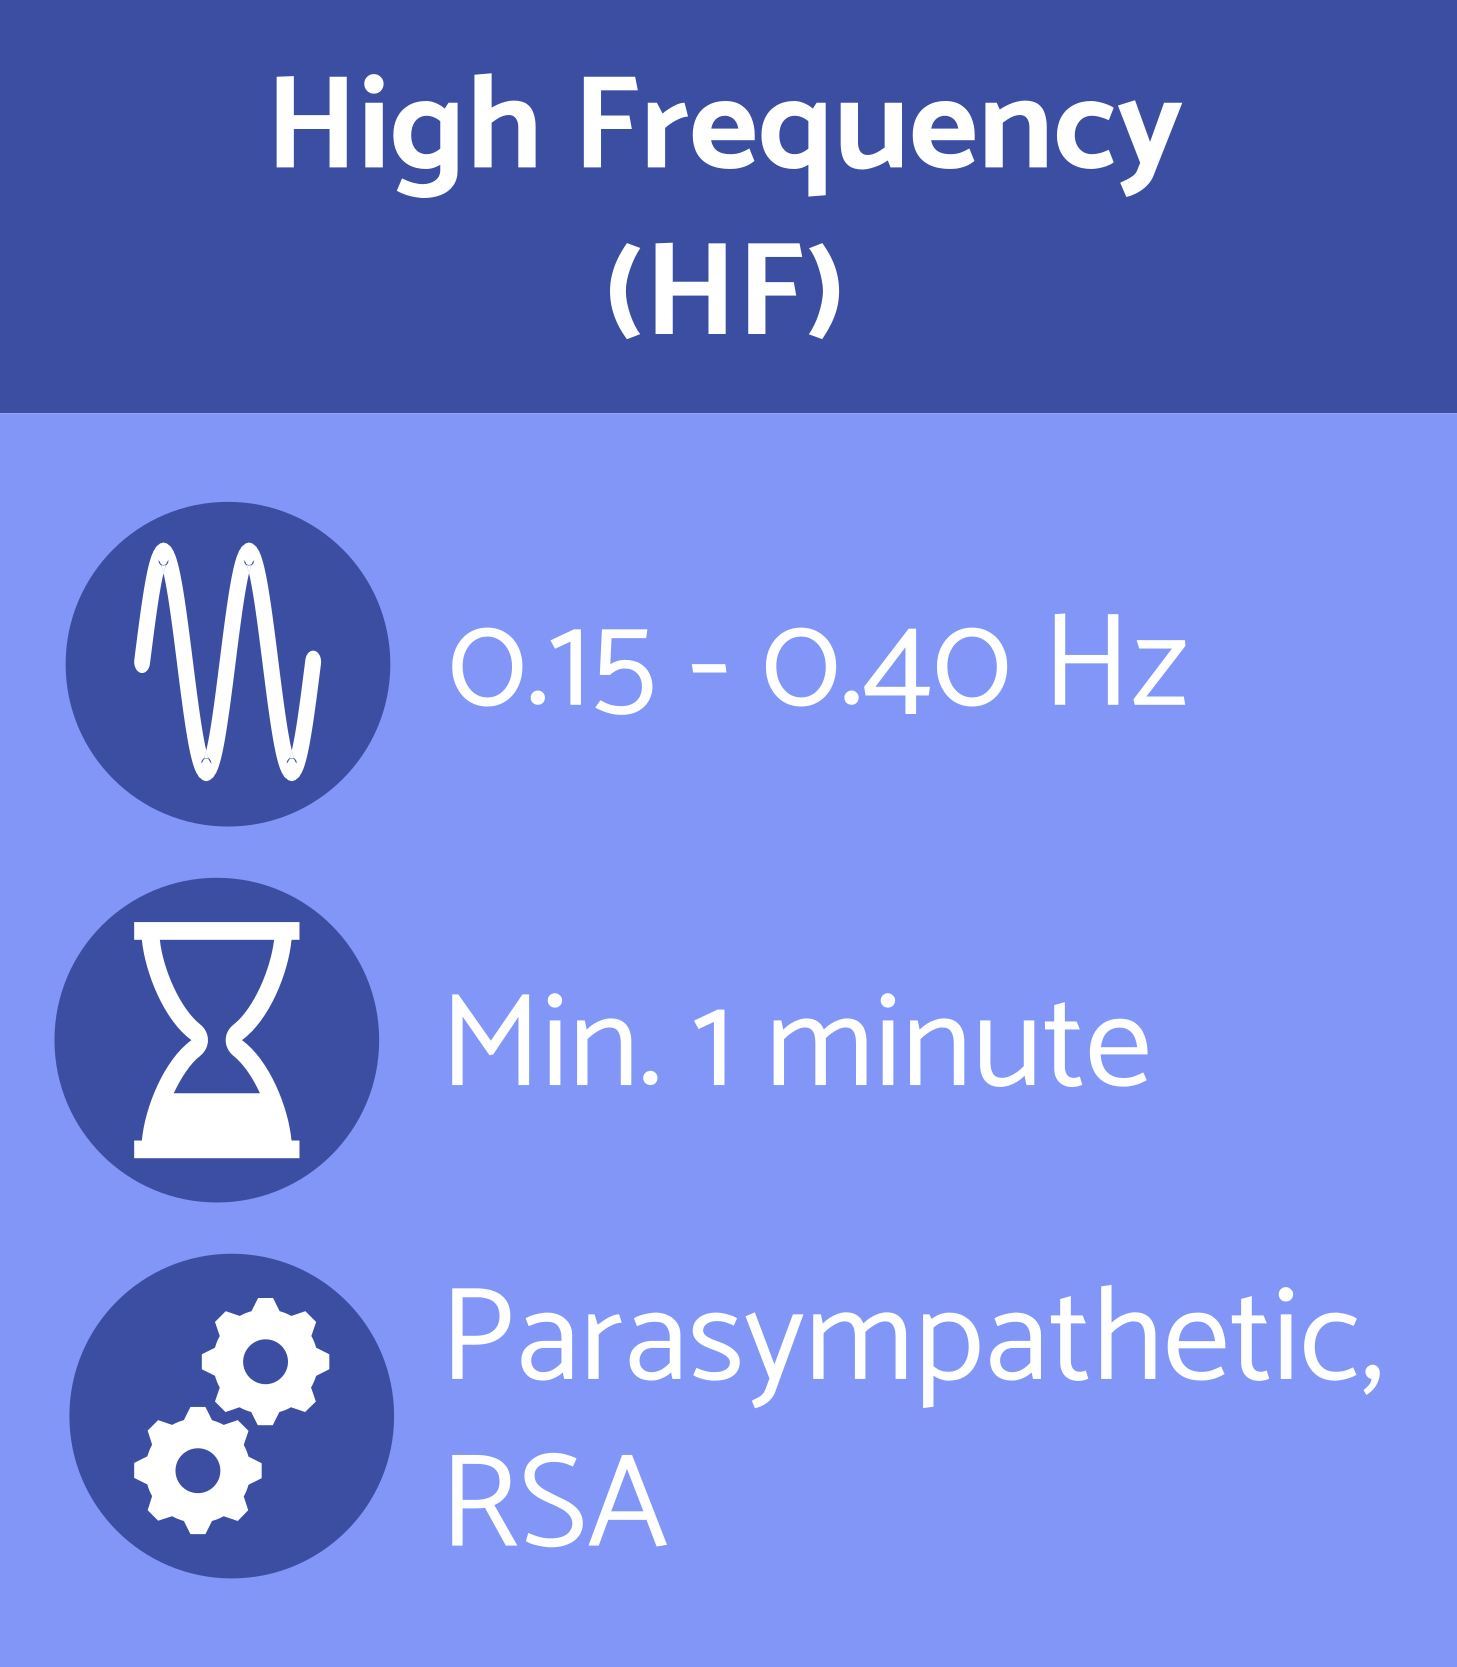 The high frequency band (HF, 0.15-0.40 Hz) consists of rhythms that repeat 9-24 times per minute. Therefore, an HRV recording of at least 1 minute is sufficient to calculate the HF value. From all frequency band, HRV is not only most easily measured, but als most ambiguous in its interpretation. The HF band predominantly reflects parasympathetic activity. Stress, panic or anxiety can, for example, cause a decrease in HF value. Besides parasympathetic activity, the HF band also reflects variations in heart rate from breathing (the respiratory sinus arrhythmia or RSA). Hence, changes in breathing rate can affect the HRV HF value. The HF value for HRV furthermore correlates well with HRV values in the time domain, such as the RMSSD and pNN50 (Figure 11).
Low Frequency (LF) band.
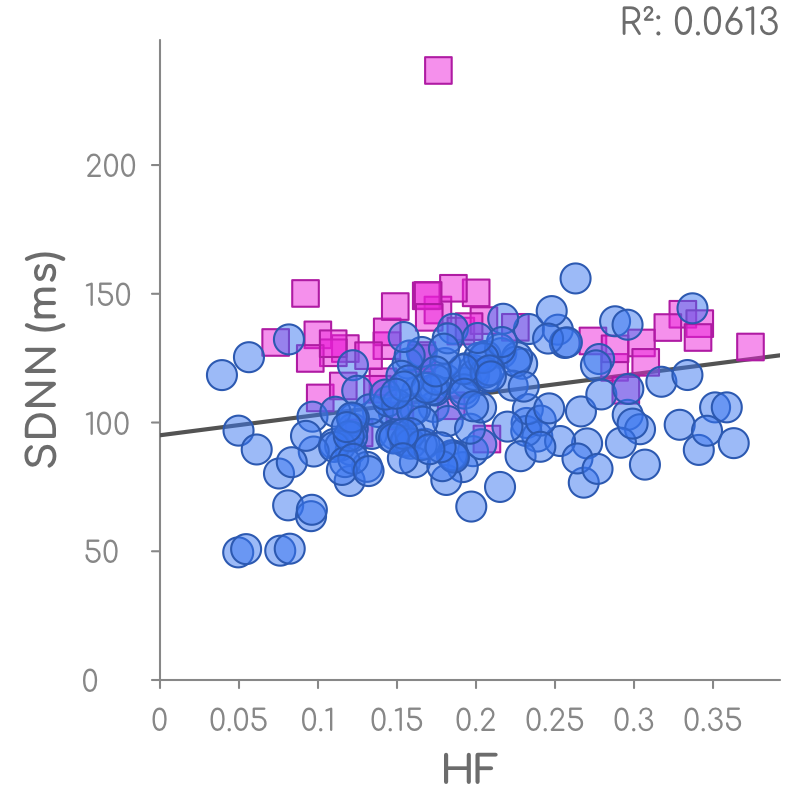
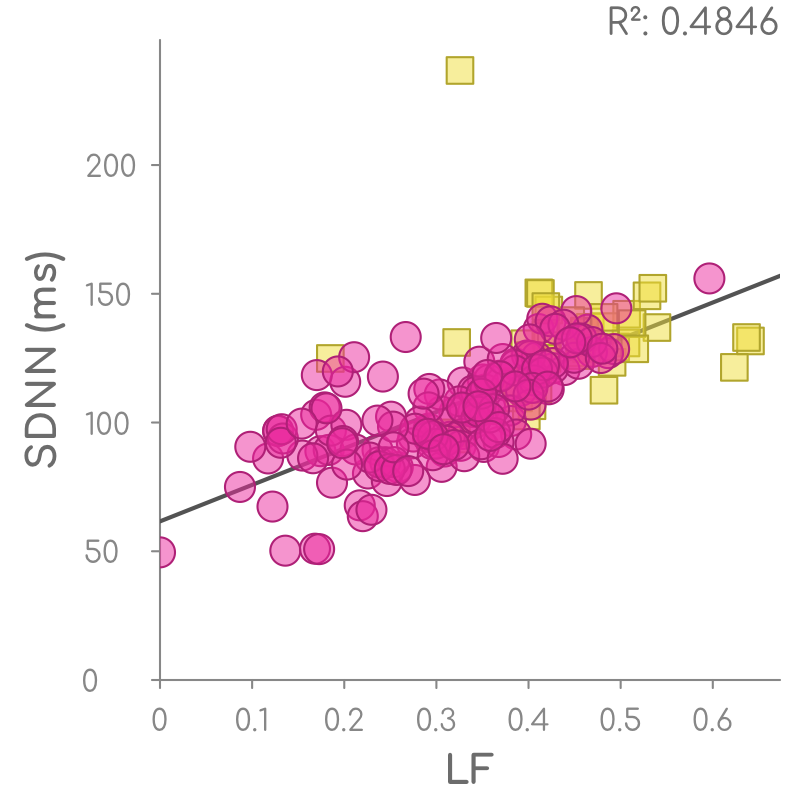
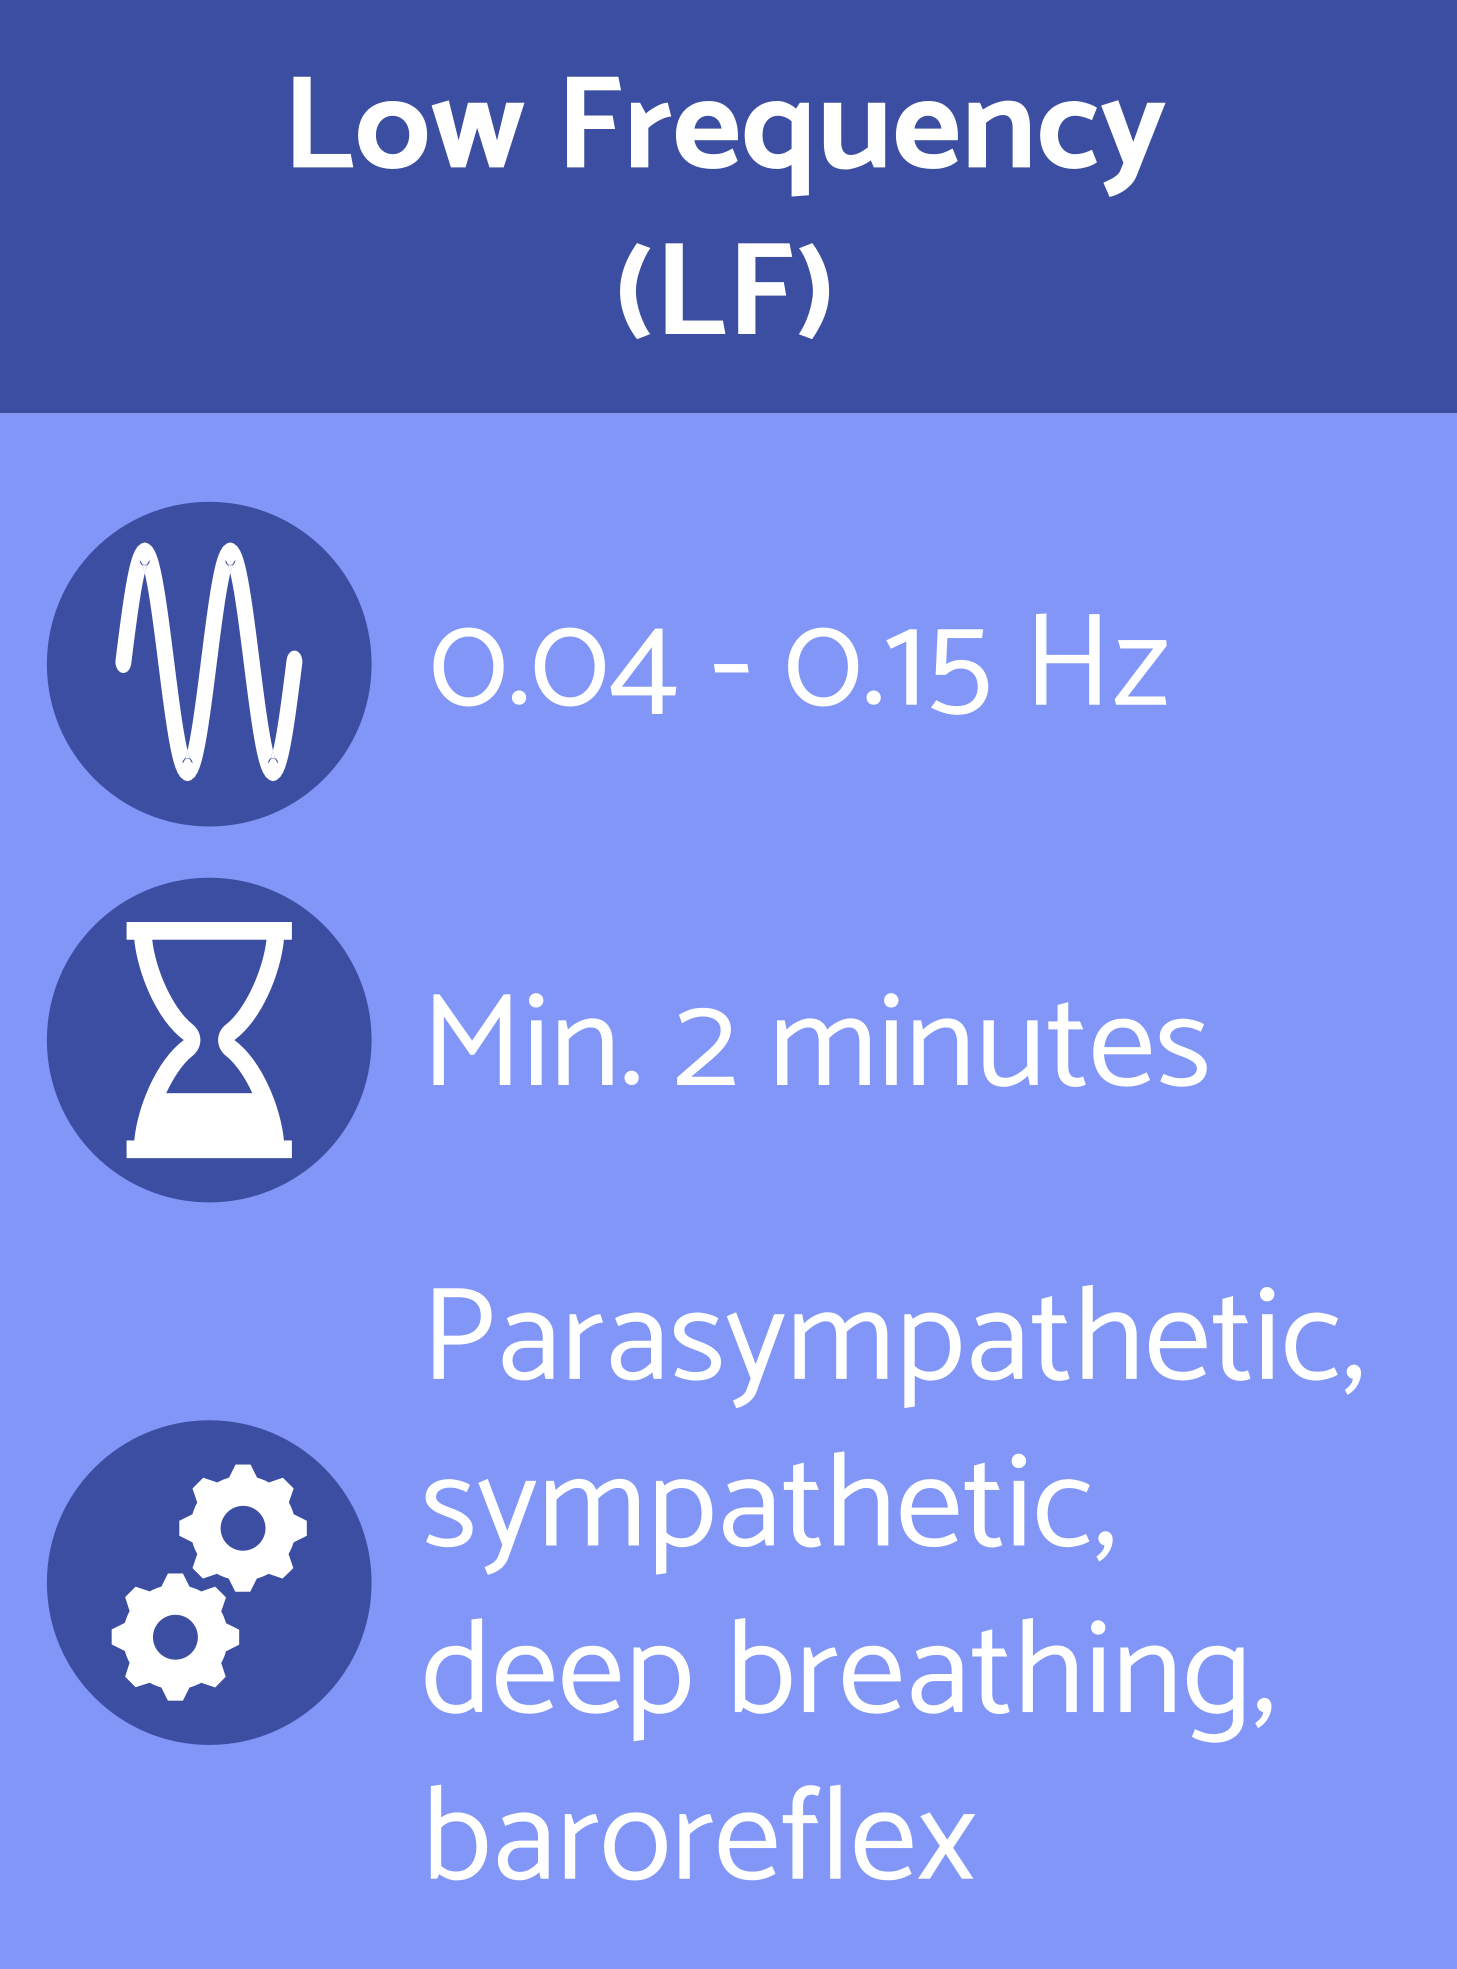 The low frequency band (LF, 0.04-0.15 Hz) consists of rhythms with a period between 7-25 sec and, therefore, requires a recording of at least 2 minutes. The interpretation of the LF HRV value is less ambiguous than the HF HRV value. Some studies suggest that the LF band is the opposite from the HF band, representing sympathetic activity. However, reality is more complicated. The frequency of a deep breath, or a sigh is, for example, low enough to reflect the effect of parasympathetic activity on heart rate in the low frequency band. Besides sympathetic and parasympathetic activity, the LF band also reflects baroreflex activity, the process that regulates sudden changes in blood pressure. The LF value for HRV correlates relatively well with the SDNN value for HRV in the time domain (Figure 12).
Very and Ultra Low Frequency (VLF/ULF) band
The lowest frequency band can be divided into the ultra low frequency band (ULF, ≤ 0.0033 Hz) and the very low frequency band (VLF, < 0.033-0.04 Hz). The rhythms underlying the VLF and ULF band are less well studied, making their interpretation less straightforward.
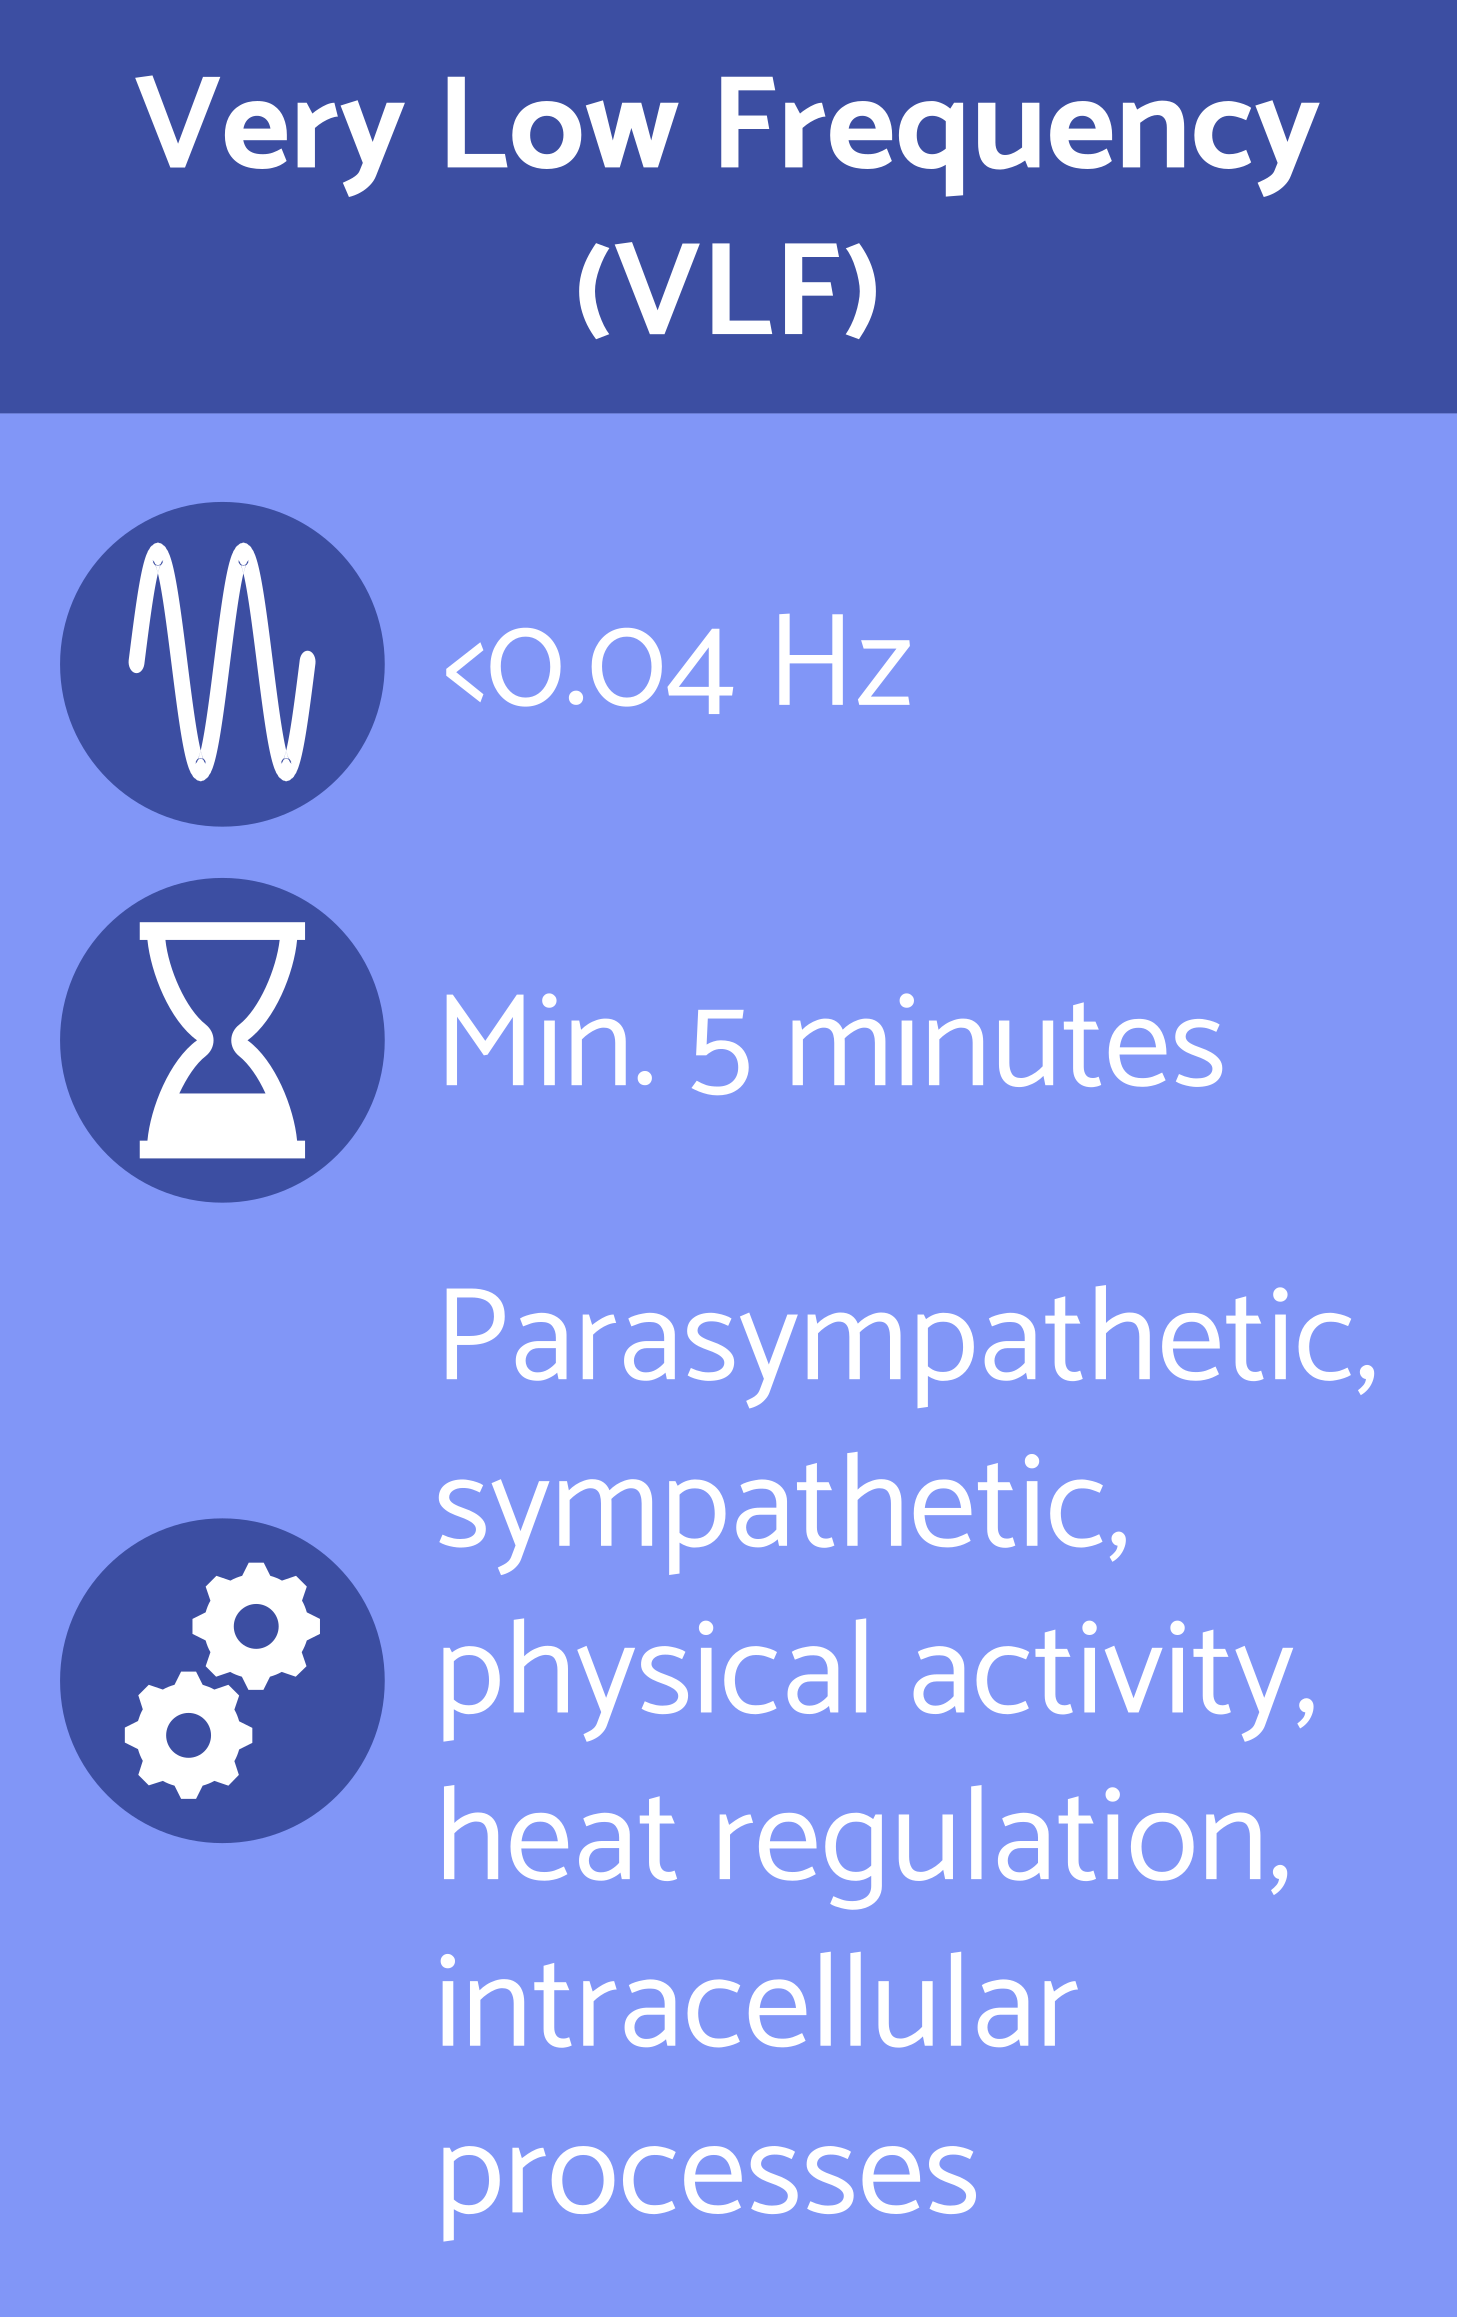
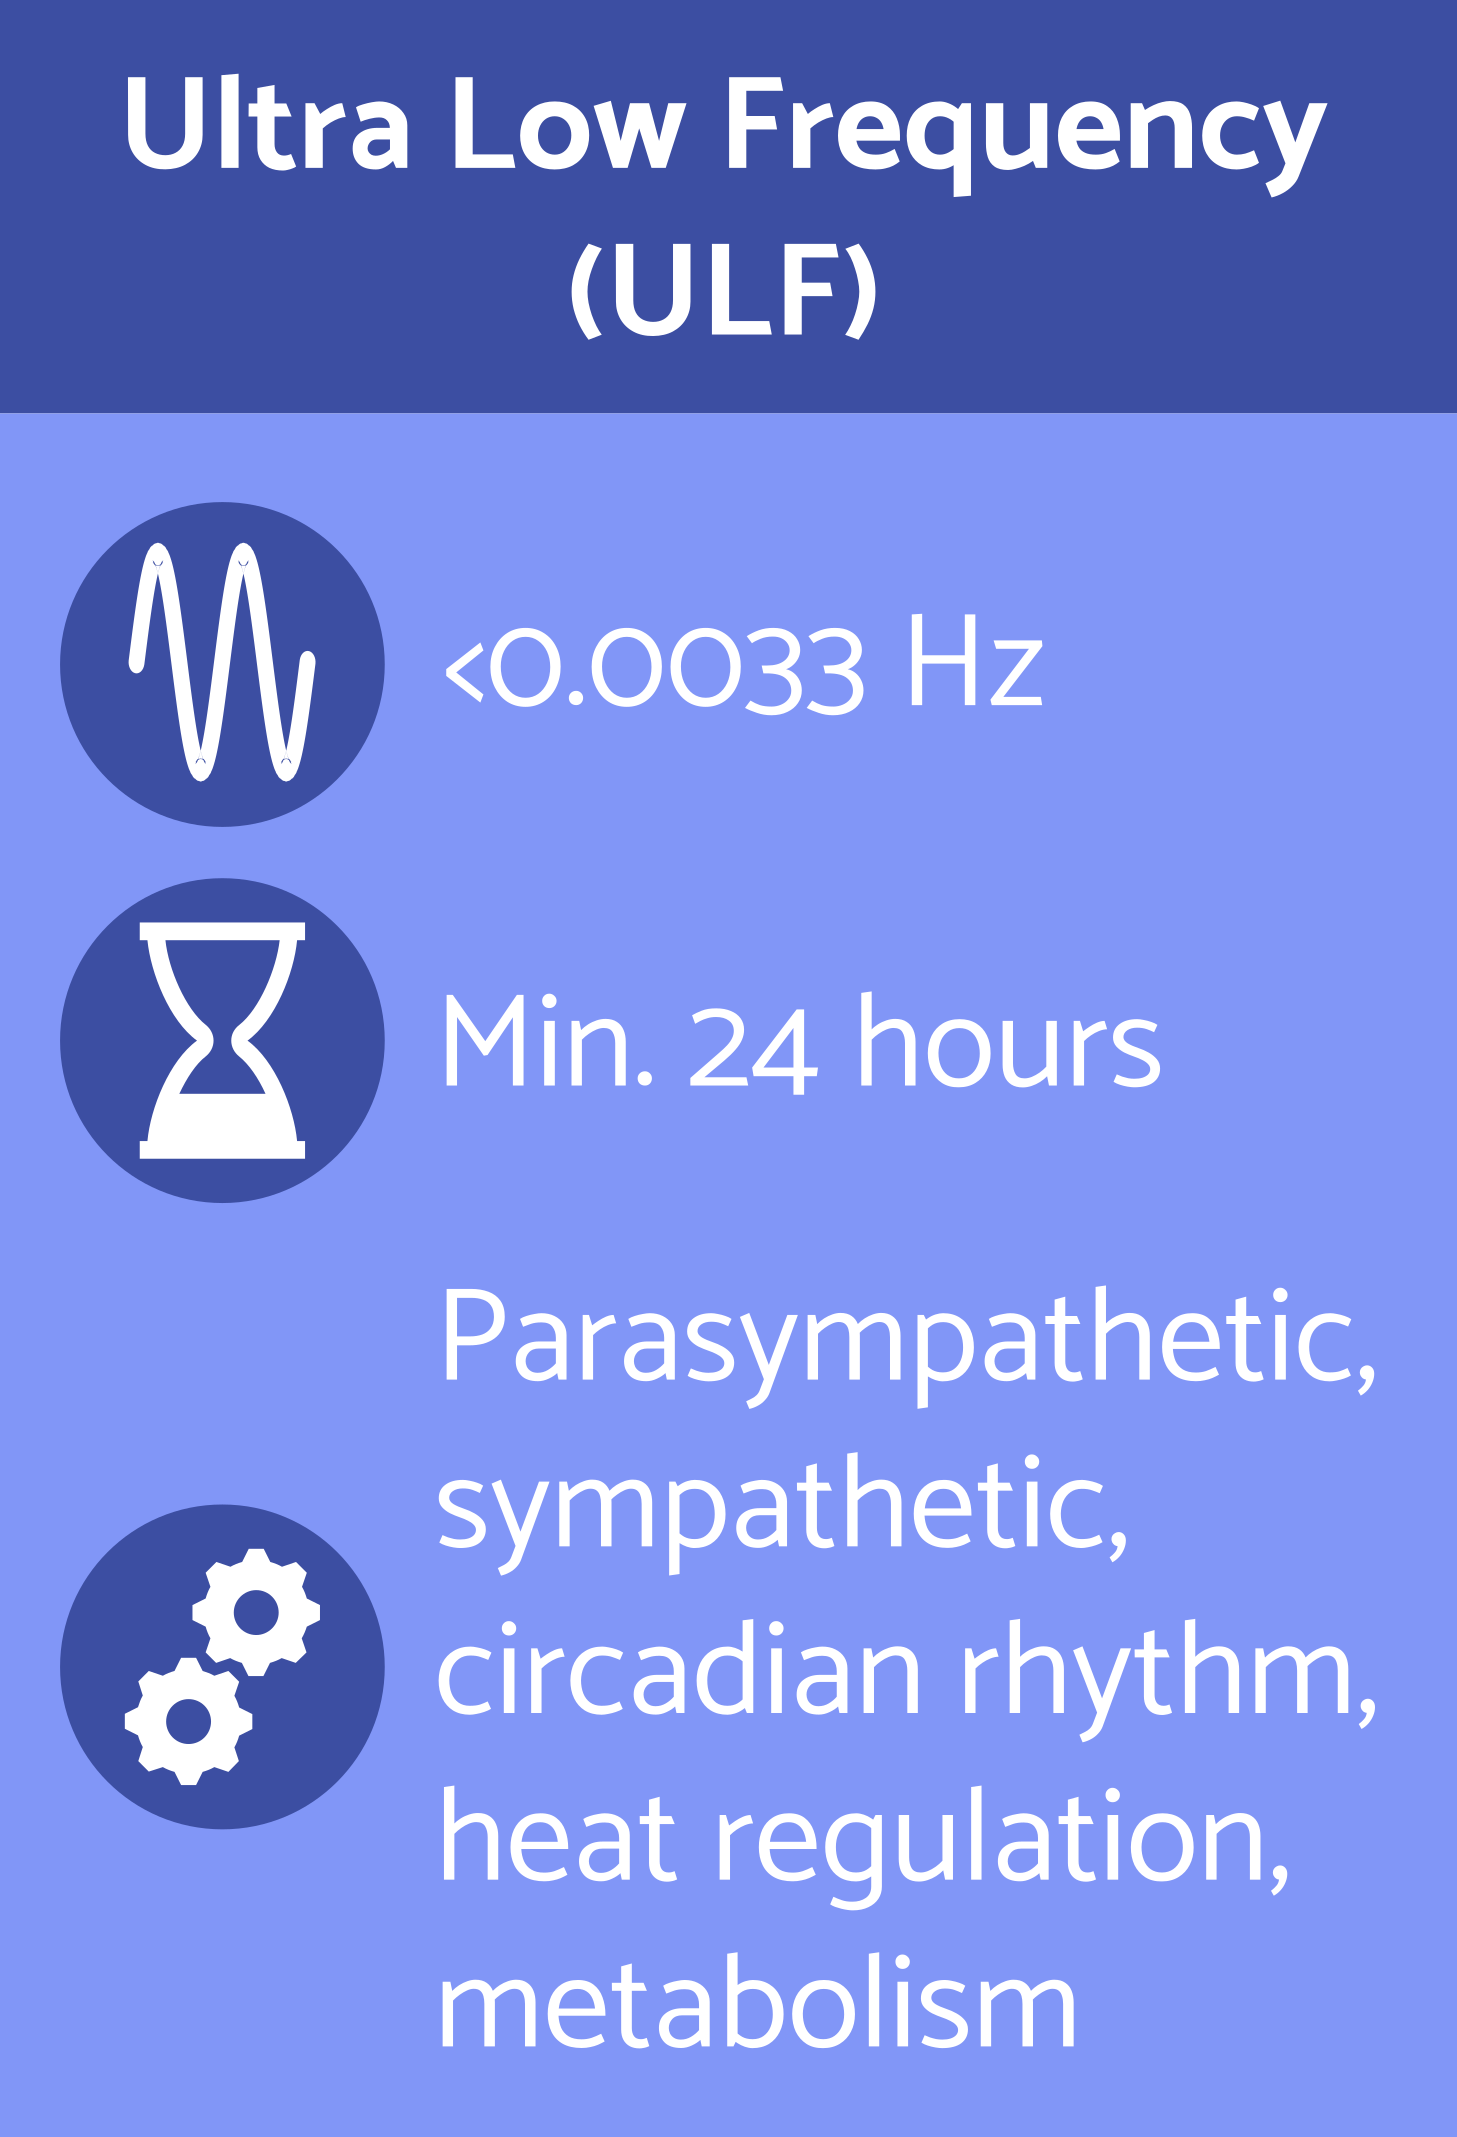 The VLF band consists of rhythms with a 25 sec to 5 min cycle, whereas the ULF band reflects variations in heart rate that occur with a rhythm of 5 min to 24 hours. Therefore, both VLF and ULF calculations require a 24-hour HRV recording. The VLF value reflects both sympathetic and parasympathetic activity, as well as e.g. physical activity, the regulation of body temperature, and body water homeostasis [1]. The slow processes that underlay the observed ULF in heart rate include the circadian rhythm, body temperature regulation or metabolism [1].
For each frequency band, the HRV can be expressed as the absolute power (the area under the curve within the specific band), the relative power (the percentage of the total area under the power-density curve), the normalized power (the absolute power normalized to standard units), or the peak frequency (the frequency with the highest power). In addition, the LF/HF ratio is sometimes used as a measure of the balance between sympathetic and parasympathetic activity. However, as discussed earlier, the LF value for HRV is not a specific reflection of sympathetic activity, making a meaningful interpretation of the LF/HF ratio not as straightforward. The various values for HRV in the frequency domain are summarized in Table 3.
Table 3: HRV measures in the frequency domain [1]
| Parameter | Unit | Description |
|---|---|---|
| Total Power (TP) | ms2 | The total area of the power density spectrum |
| Absolute Power | ms2 | The area of the power density spectrum for each frequency band |
| Relative Power | % | The ratio of absolute-to-total power |
| Normalized Power | The relative power in standard units | |
| Peak Frequency | Hz | The frequency with the highest power within each frequency band |
| LF/HF ratio | % | Ratio of LF-to-HF power |
Non-linear HRV analysis
Non-linear methods for HRV reflect the unpredictability of the variation in heart rate, providing insights in heart rate variability that are not possible to obtain by analysis in the time or frequency domain (Table 4).
Table 4: Non-linear parameters for HRV [1].
| Parameter | Unit | Description |
|---|---|---|
| S | ms | Area of the ellipse which represents total HRV |
| SD1 | ms | Poincaré plot standard deviation perpendicular to the line of identity |
| SD2 | ms | Poincaré plot standard deviation along the line of identity |
| SD1/SD2 | % | Ratio of SD1-to-SD2 |
| ApEn | Approximate Entropy, which measures the regularity and complexity of a time series | |
| SampEn | Sample Entropy, which measures the regularity and complexity of a time series | |
| DFA | Detrended Fluctuation Analysis | |
| DFA α1 | Measure for short-term HRV fluctuations | |
| DFA α2 | Measure for long-term HRV fluctuations |
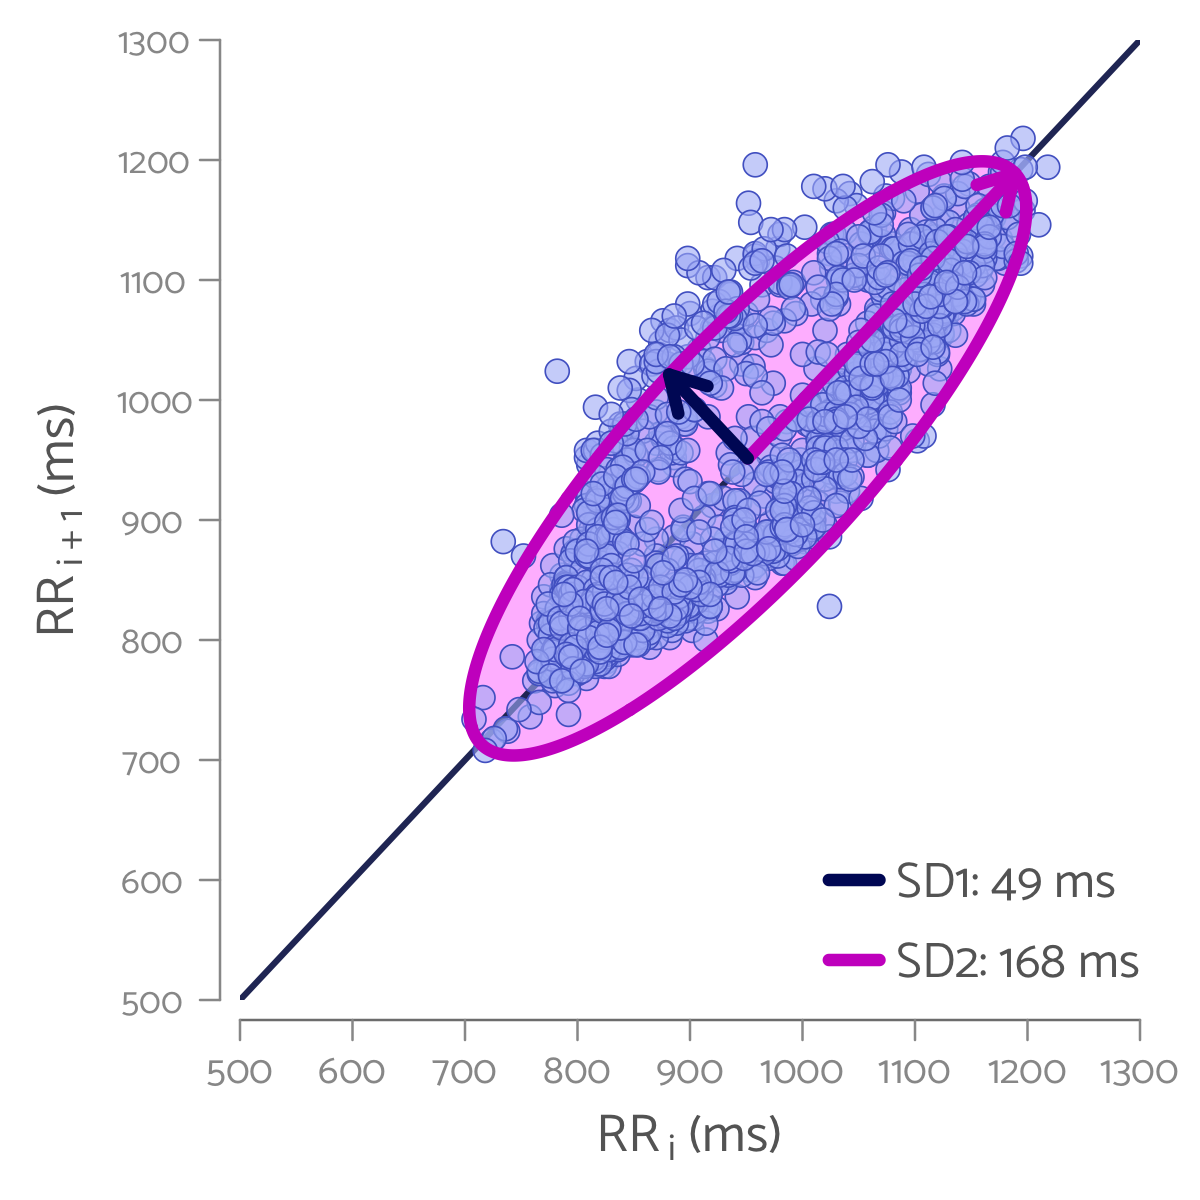
Poincaré plot
In a Poincaré plot (Figure 12), every R-R interval is plotted against the preceding R-R interval. Hence, the Poincaré plot not only visualizes the distribution in R-R intervals but also how each R-R interval relates to the previous, enabling easy detection of deviating or ectopic heart beats.

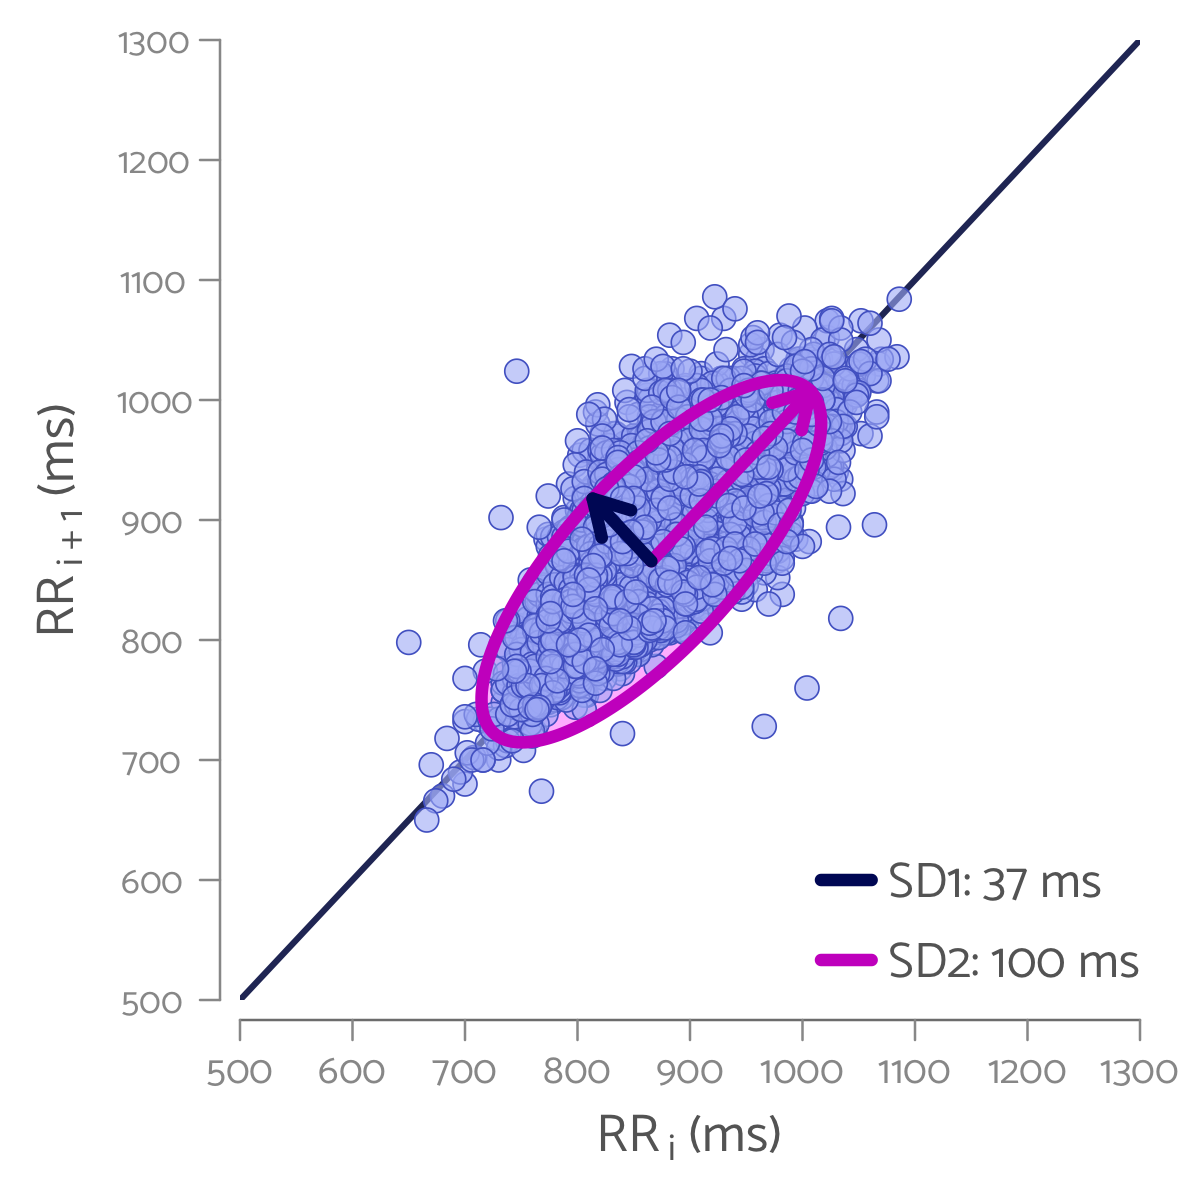
By drawing an ellipse around the data points in the Poincaré plot, various measures for HRV can be obtained based on the size and shape of the ellipse: – The area of the ellipse (S) represents the total HRV.
- The width of the ellipse (SD1 or the standard deviation perpendicular to the line of unity) reflects short-term variability.
- The length of the ellipse (SD2 or the standard deviation parallel to the line of unity) reflects the long-term variability.
- The shape (SD1/SD2 or excentricity) represent the unpredictability of the R-R intervals.
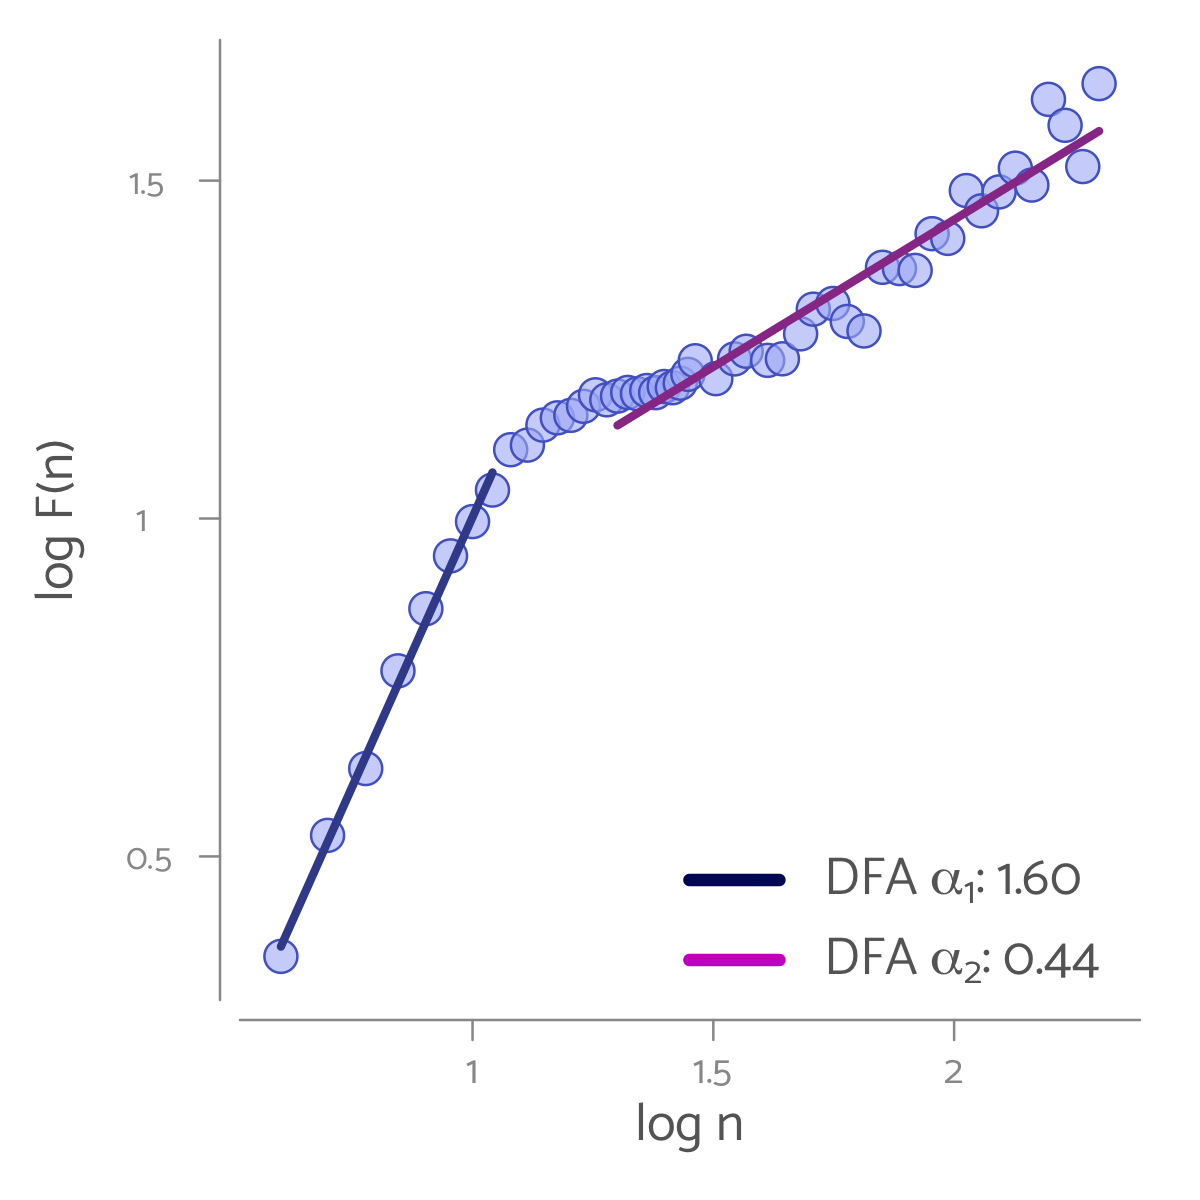
Detrended Fluctuation Analysis (DFA)
Detrended fluctuation analysis (DFA) divides an HRV recording into multiple segements of the same length (n) and then calculates the average trend or fluctuation (F) across these segments. By repeating this procedure for time intervals with different lengths, the fluctuation can be presented as a function of the time interval (F(n)). In the obtained DFA graph (Figure 13), two slopes can be observed: slope α1 reflecting the short-term variability in HRV (~4-11 R-R intervals) wand slope α2 reflecting the long-term variability in HRV.
The DFA α1 can be seen as the noise index of the underlying data. A DFA α1 of 1 means that the probability of the variability in the data being random equals the probability of the variabilty in the data being under regulated control. A DFA α1 below 1 indicates less correlation and more chaotic and random data. A DFA α1 below 0.8 indicates a disturbed regulation of the heart rate.
DFA is mostly used for long-term HRV recordings. Recently,DFA, in particular the DFA α1, has found its way into sports physiology as an alternative, HRV-based, method for aearobic and anaerobic threshold detection. A DFA α1 above 0.75, for example, reflects a training intensity for endurance training [3].
HRV analysis summary
For short-term HRV recordings (several minutes, e.g. for daily HRV monitoring) with common commercial heart rate monitors, the RMSSD is the method of choice for the calculation of HRV. The calculation of the RMSSD is reproducible and, in contrast to the SDNN, better represents short-term heart rate variability. For HRV measurement in the frequency domain, only the HF has an unambiguous meaning. The calculation of the lower frequency bands is less accurate with shorter recordings and, in addition, the interpretation of the lower frequency bands is hampered by the complexity of the various underlying processes. The non-linear methods are of interest when a visual representation of the data helps to gain better insights.
Conclusion
Although heart rate variability is proposed as an objective measure of mental and physical well-being, HRV values measured with different devices, under different circumstances or in different individuals can not be easily compared. To implement HRV monitoring in your health tracking habits, it is good to know which method your device uses to calculate HRV and to make sure that you take a regular HRV recording (at least 3 times per week) under identical conditions, preferably in the morning upon awakening in a supine position.
References:
[1] Shaffer F and Ginsberg JP (2017)
An Overview of Heart Rate Variability Metrics and Norms. Front. Public Health 5:258.
[2] Task force of the European society of cardiology and the North American society of pacing and electrophysiology (1996)
Heart rate variability – standards of measurement, physiological interpretation, and clinical use. Circulation, 93(5):1043.
[3] Rogers B et al. (2021)
A New Detection Method Defining the Aerobic Threshold for Endurance Exercise and Training Prescription Based on Fractal Correlation Properties of Heart Rate Variability. Front Physiol, 11:596567.
Further resources about HRV:
- EliteHRV blog.
- HRV4Training blog.
- Kubios HRV software.
- Getting started with RHRV. Tutorial for using the RHRV package for R.
- Posted on:
- September 15, 2022
- Length:
- 19 minute read, 3846 words
- Categories:
- Body Health & Science
- See Also: